Who knew that the sheriff riding into town would be bad for the ICO business?
click chart to enlarge
click chart to enlarge Solunar and tidal charts, plus video discussion inside.
click chart to enlarge
click chart to enlarge Solunar and tidal charts, plus video discussion inside.
click chart to enlarge
click chart to enlarge
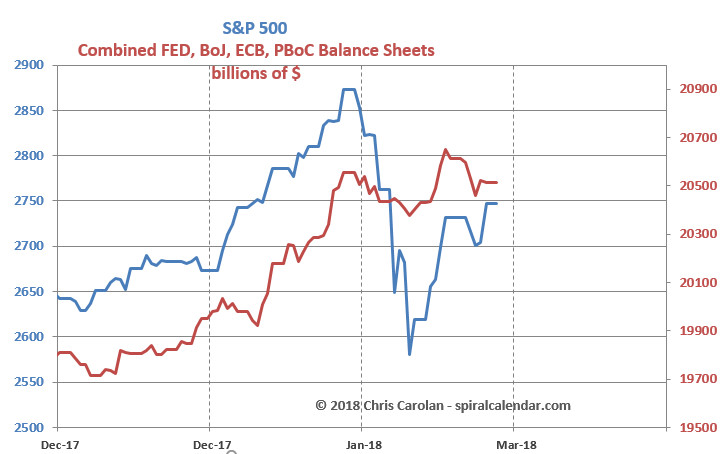
Does anything beside the Money Printing Pump matter? We should find out tomorrow with the late news of the Cohn resignation.
click chart to enlarge

click chart to enlarge
click chart to enlarge
click chart to enlarge
click chart to enlarge
click chart to enlarge
Everything has turned south quickly, and the dollar rally has barely begun!
click chart to enlarge The dollar is holding stocks hostage.
click chart to enlarge The tidal chart is usually behind the paywall. But it is so pretty.
click chart to enlarge
click chart to enlarge

click chart to enlarge
Solunar and tidal charts as well as a video discussion of daily and weekly candle charts is inside. click chart to enlarge
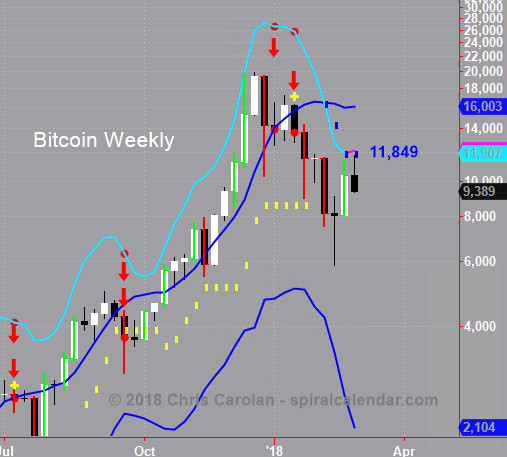
Bitcoin reversed right on the upper, daily Keltner channel level on Tuesday. The expired 9372 net line level is providing some support over the past 24 hours.
 click chart to enlarge

click chart to enlarge