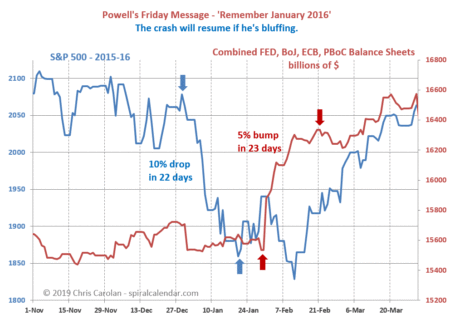
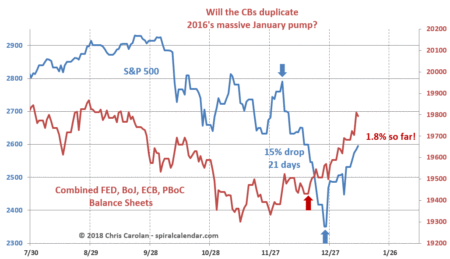
The Money Printing Pump is in gear. But it’s being driven by the lower dollar, not CB printing. It’s still getting the job done for now.
click chart to enlarge
click chart to enlarge
Commentary in today’s video discussion.
click chart to enlarge
click chart to enlarge
click chart to enlarge
click chart to enlarge
click chart to enlarge
Chris,
Thanks for the interesting work.
Wanted to pass this by you and get your thoughts, please.
Every year I look for similarities with your four cardinal “moon” dates of 1929 / 1987.
I thought that the analogy was particularly helpful last year.
Starting with the 2018 new moon of April 15, 2018:
Spring low: July 5 was not the exact low but it was a bullish day nonetheless as it was the last day that the DJIA was under its 200-day moving average for many months.
Summer high: October 10 was not the exact high but marked a bearish day nonetheless as it was the day of an 850 point decline in the DJIA.
Secondary high: November 16 was a top wherein the DJIA fell 4% in two days.
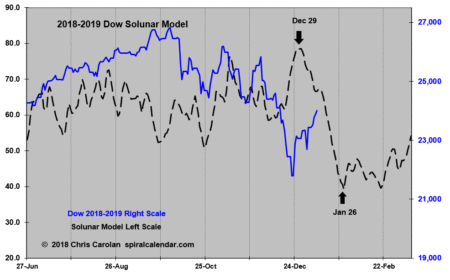
Crash: December 3 was not a crash but a bearish day nonetheless as the DJIA started its fall of 15% in three weeks.
Do you agree that the analogy was prescient?
Or, maybe it is your opinion that am I inferring correlation where there is none?
Ted