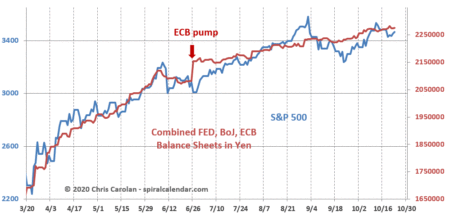
The Money Printing Pump chart directly below continues its tight correlation with equity prices.
Inside, the Solunar Model charts have been updated through the second quarter of 2021.
click chart to enlarge
click chart to enlarge
click chart to enlarge
Subscribe to see the rest of this post.


