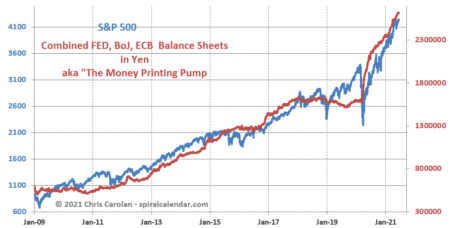
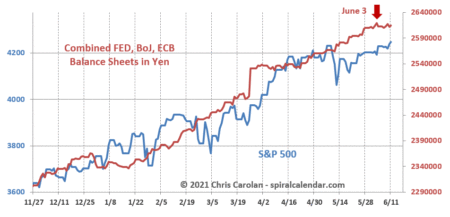
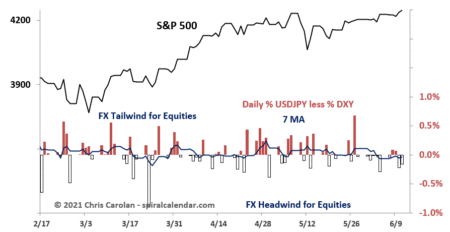
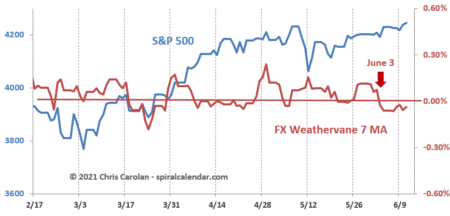
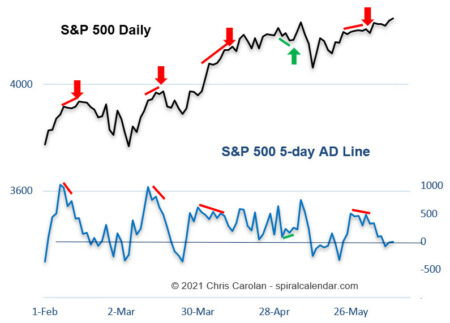
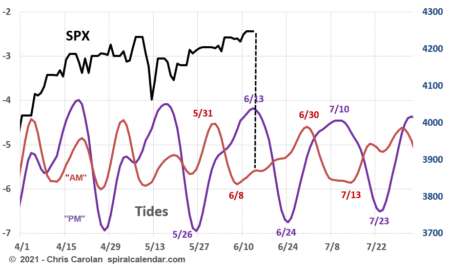
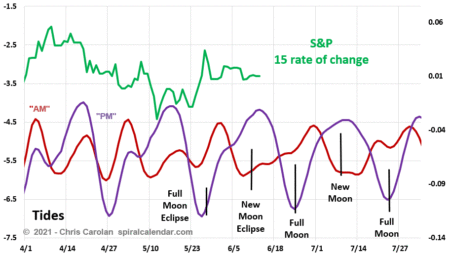
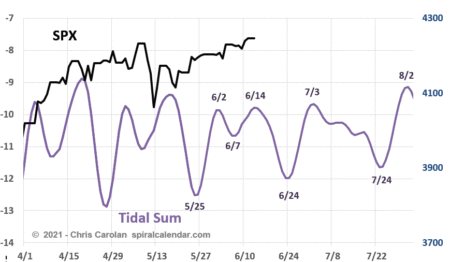
Liquidity has been tightening a bit since about June 3.
click chart to enlarge
click chart to enlarge
click chart to enlarge
click chart to enlarge
click chart to enlarge
click chart to enlarge
click chart to enlarge
click chart to enlarge
click chart to enlarge
click chart to enlarge
click chart to enlarge
click chart to enlarge
click chart to enlarge
click chart to enlarge
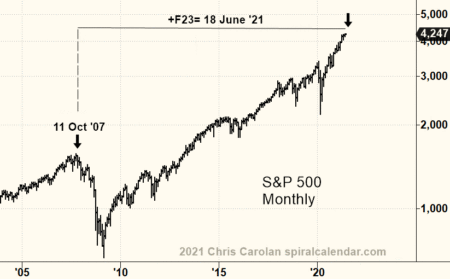
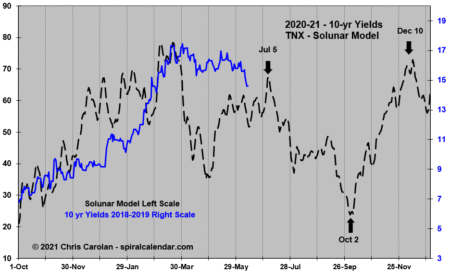
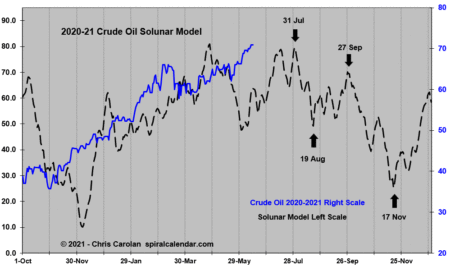
Because this is monthly spiral for June 18 does this mean it’s a top that can last for months?
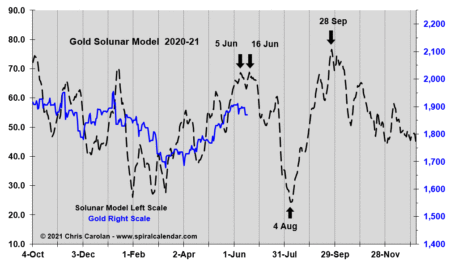
Also could you please update the chart where you have the yen and gold and whether it showing deflation or inflation?
Thanks!