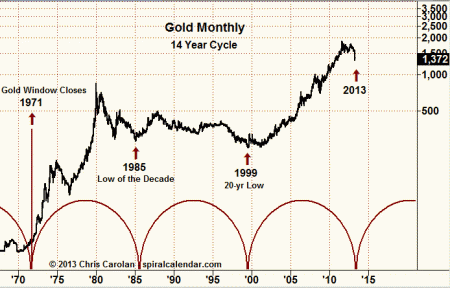
The monthly gold chart below shows a very nice 14 year cycle vibration from one of the major events in financial history, the closing of the gold window in 1971. The two subsequent lows mark the lowest price in the 1980s as well as the final 1999 low of that 20 year bear market. The next year in the cycle is 2013.
click to enlarge
The more interesting relationship is present in the Spiral Calendar - discussed within for subscribers.
Subscribe to see the rest of this post.
