click chart to enlarge Climbing a Stairway to Heaven
click chart to enlarge
click chart to enlarge
click chart to enlarge Climbing a Stairway to Heaven
click chart to enlarge
click chart to enlarge
click chart to enlarge
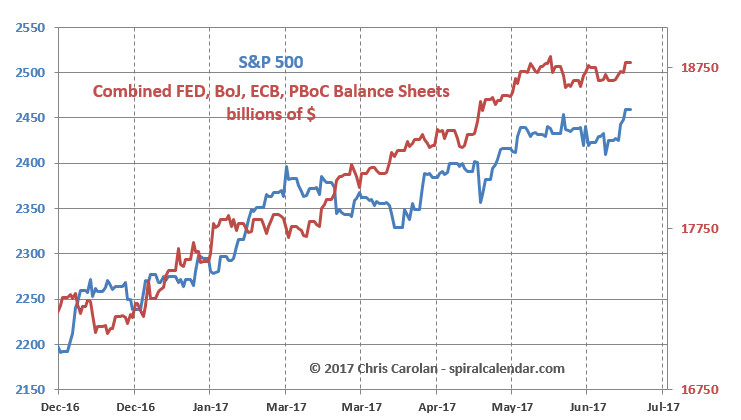
Hey look! Combined central bank balance sheets have stopped rising! (for now)
click chart to enlarge

click chart to enlarge
Apologia – I intended to produce regular video updates while traveling, but a myriad of technological roadblocks intervened. Next update will be Wednesday, from home turf, with complete chart sets and video discussion.
In the meantime – the big move in bonds I’ve been talking about is just getting underway. And now is the time for the Solunar and Tidal charts (inside below) to kick in.
click chart to enlarge
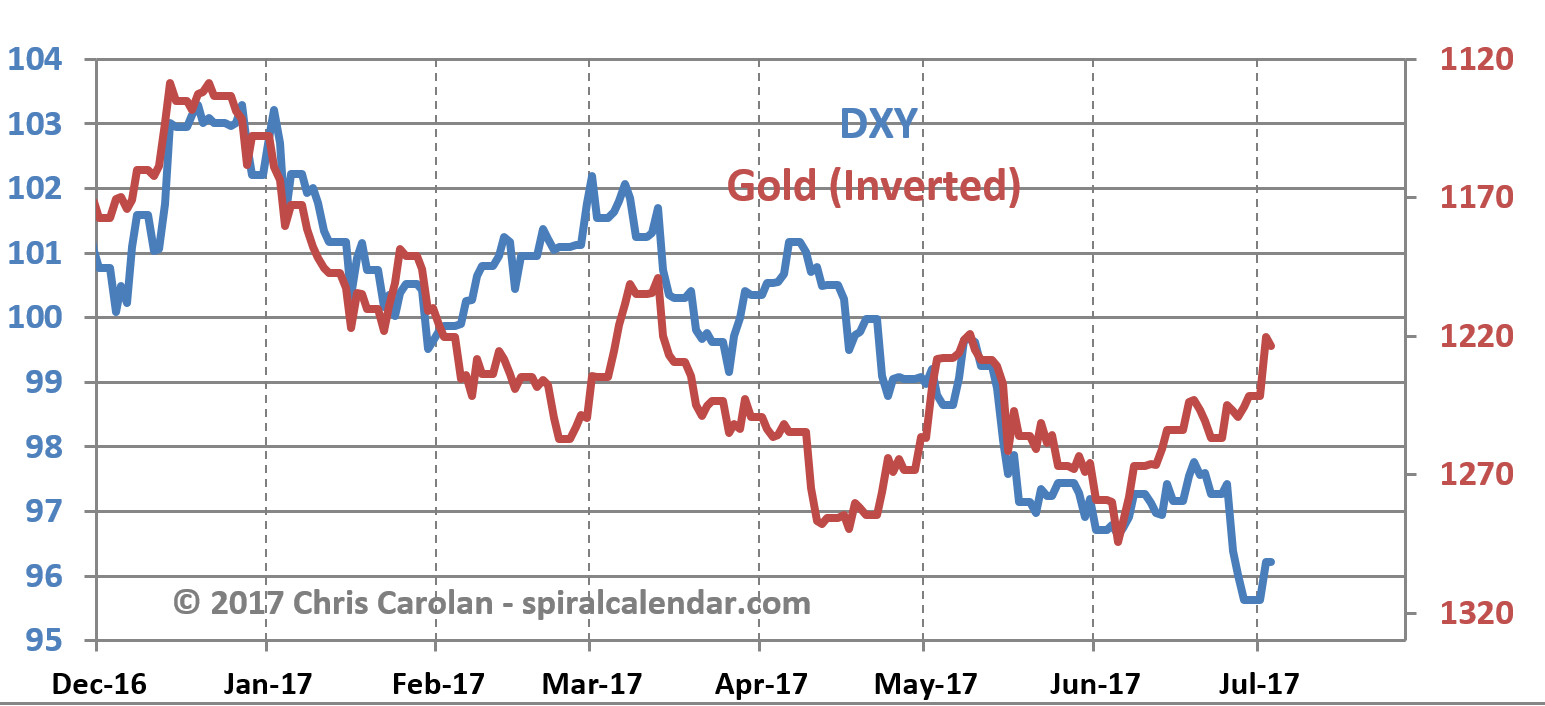
The weak dollar index is not a reason for gold to go up.
click chart to enlarge
The yen is even weaker than the dollar. As long as the dollar is strong against the yen, gold will be weak.Vacation posting will be sporadic. I had hoped to post this weekend, but remote difficulties means next update should be Monday, July 3.
click chart to enlarge
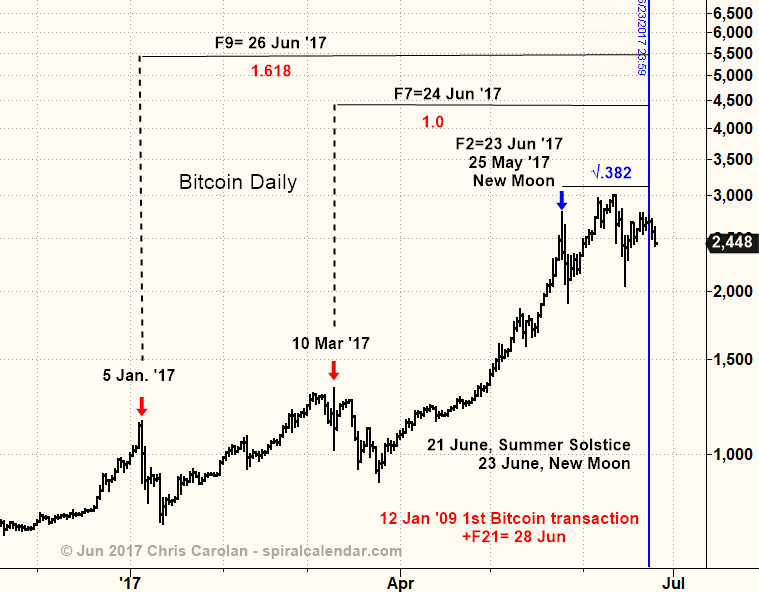
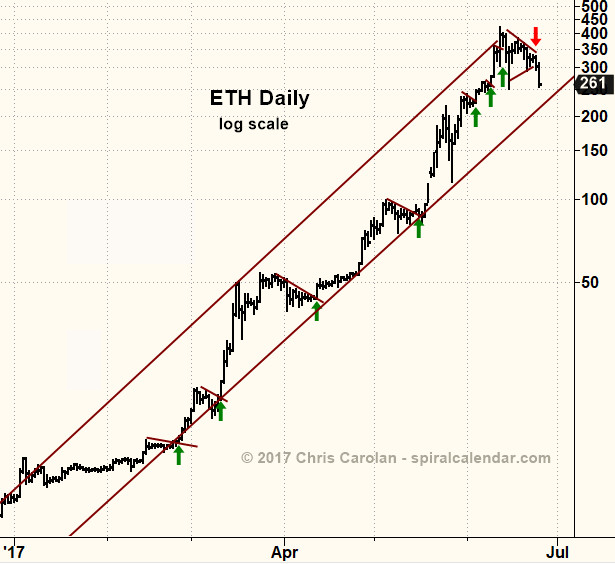
click chart to enlarge The mood in the crypto-currency space has changed dramatically since Friday's new moon!
click chart to enlarge
Mania leader, Ethereum's final triangle broke lower from its apex.
click chart to enlarge
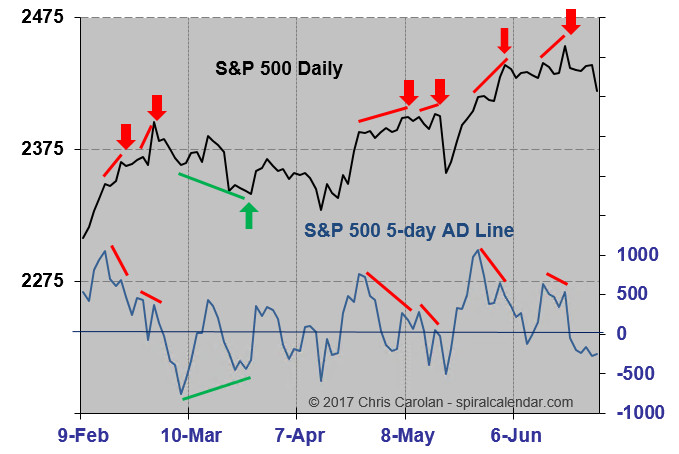
Will stocks care? Video discussion and more charts inside!
click chart to enlarge