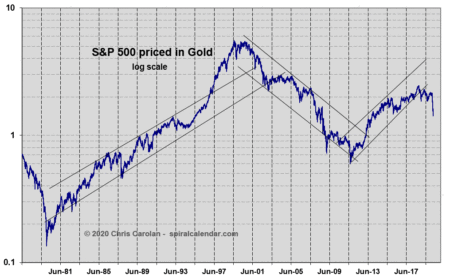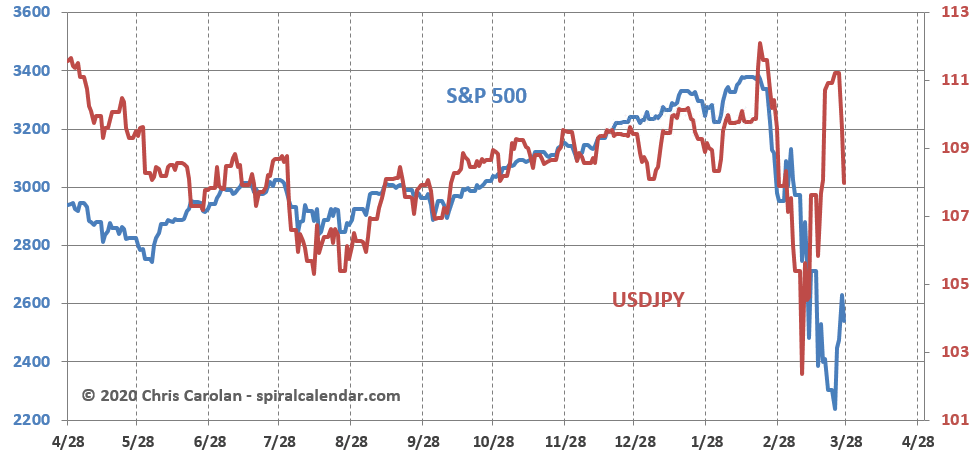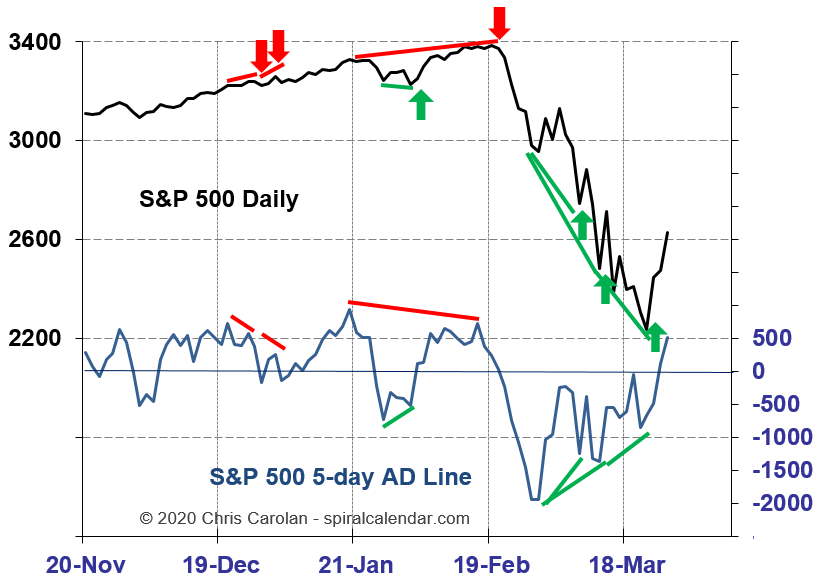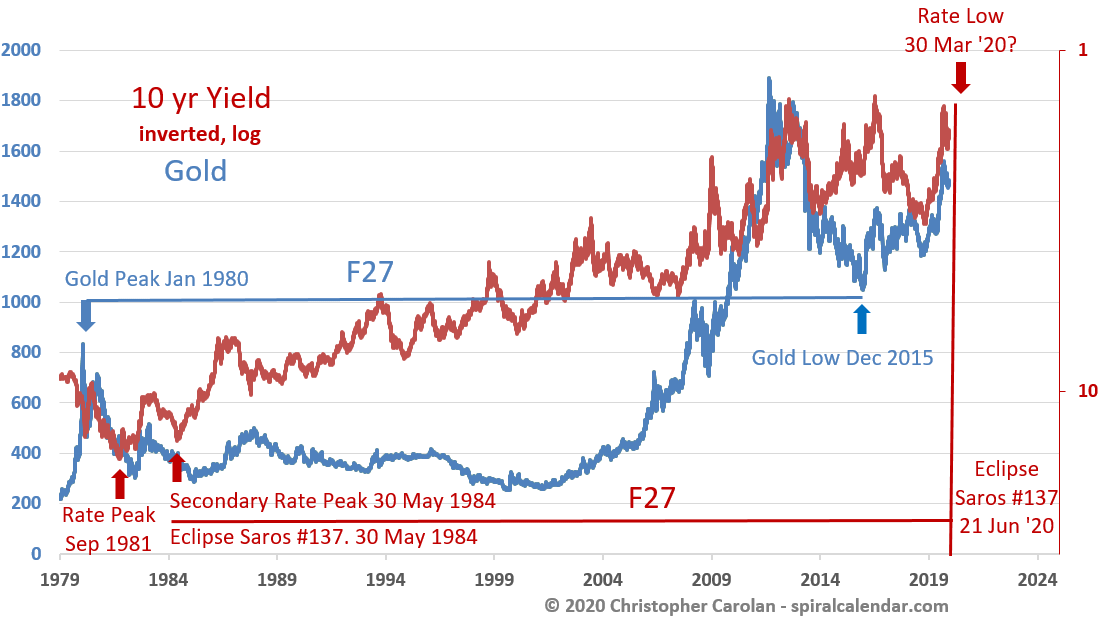
click chart to enlarge Original chart published January 20, 2020
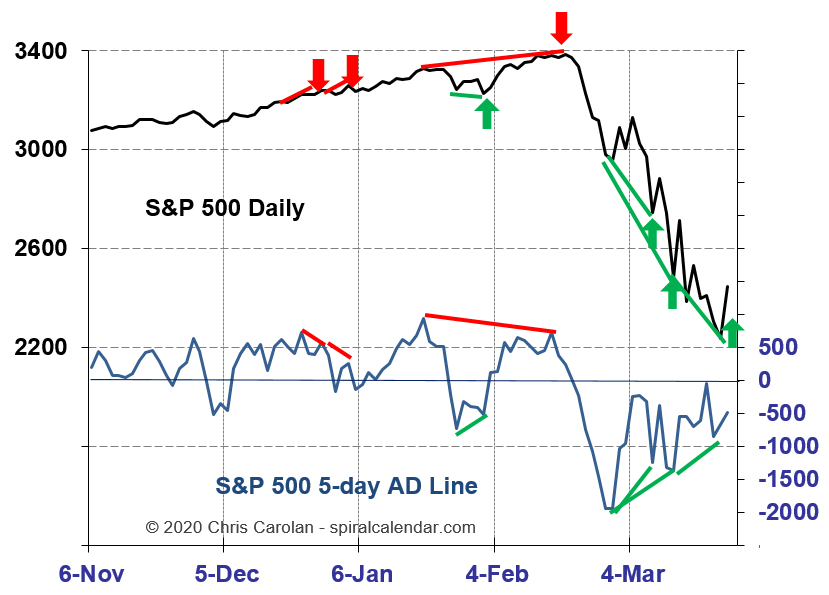
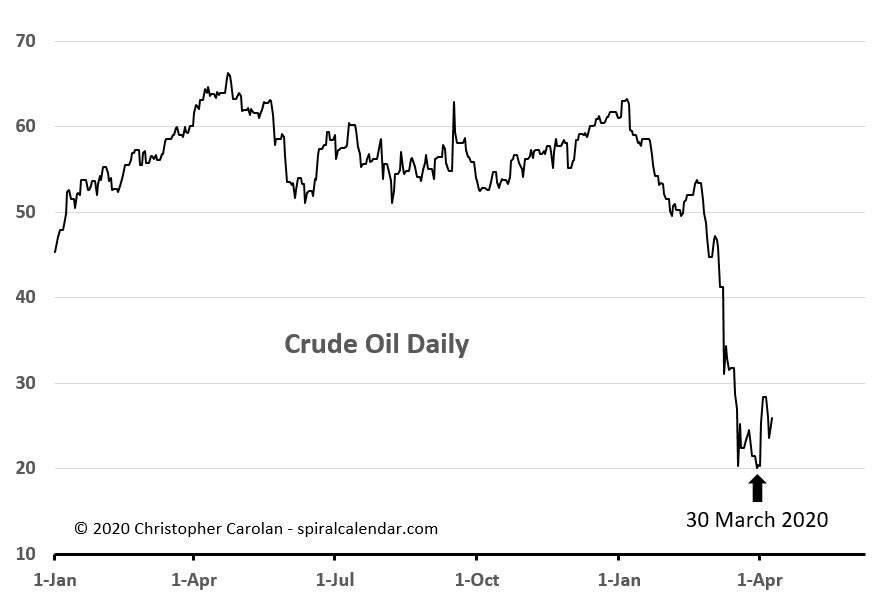
The "Timing the Top Part 2" video discussion in January called for an end to the Long-Waves deflationary cycle on March 30, based on this Spiral Calendar relationship in interest rates. At the time of the video, there was no overriding deflation. The price of oil was at $58.
click chart to enlarge
click chart to enlarge
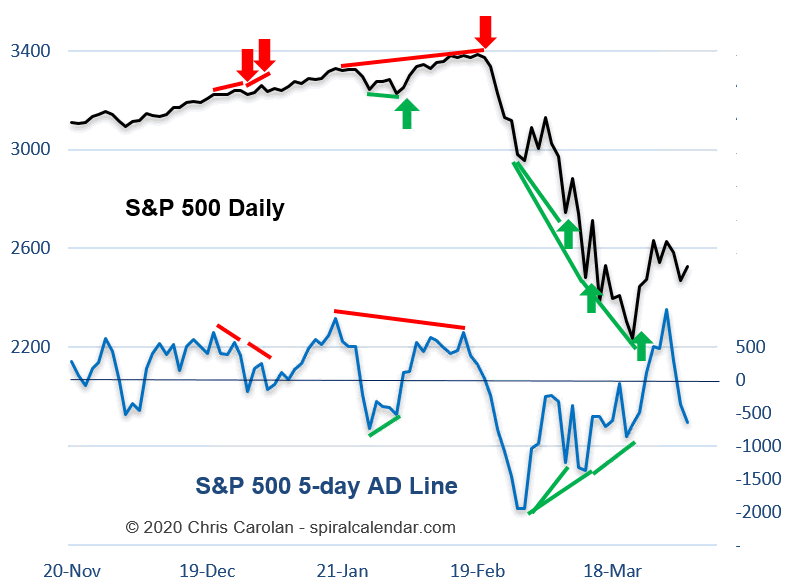
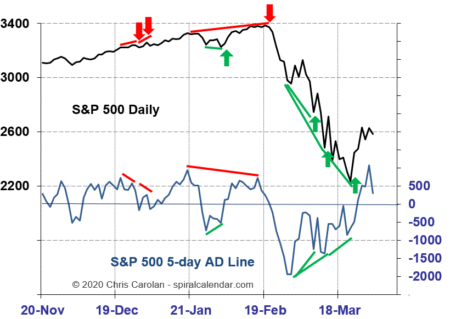
Nine weeks later crude oil bottom below $20 exactly on March 30. The consensus opinion is that a deflationary period has just begun. Remember the original Spiral Calendar forecast however. That forecast says March 30 was the END of a deflationary cycle! Crude oil, and the collapse of the bond markets earlier in the month tell us we hit a bulls-eye with our January "Timing the Top, Part 2" video. Following the dramatic, pinpoint forecast of the end of the bitcoin mania in 2017 to the day, the Spiral Calendar has now, once again, pinpoint with uncanny accuracy a major financial inflection. Last January, I called for the end of the bond bull for March 2020. I never realized the credit markets would implode that month!
What about stocks? Ahh, they will not be so easy! That discussion continues in today's video.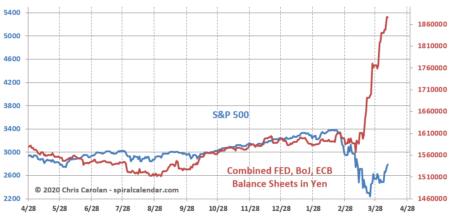
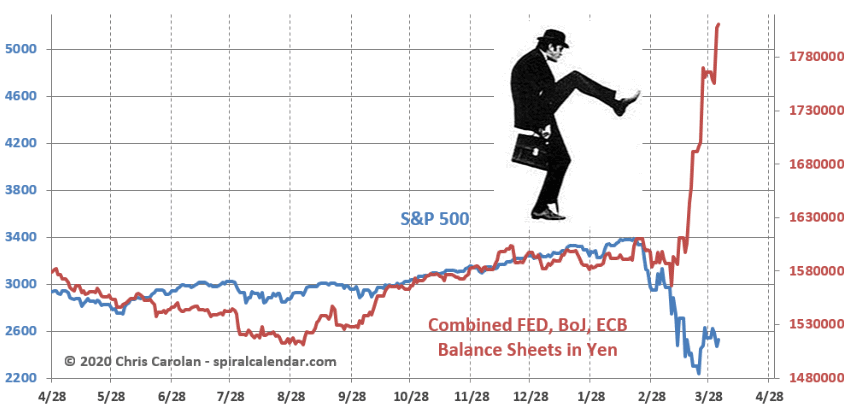
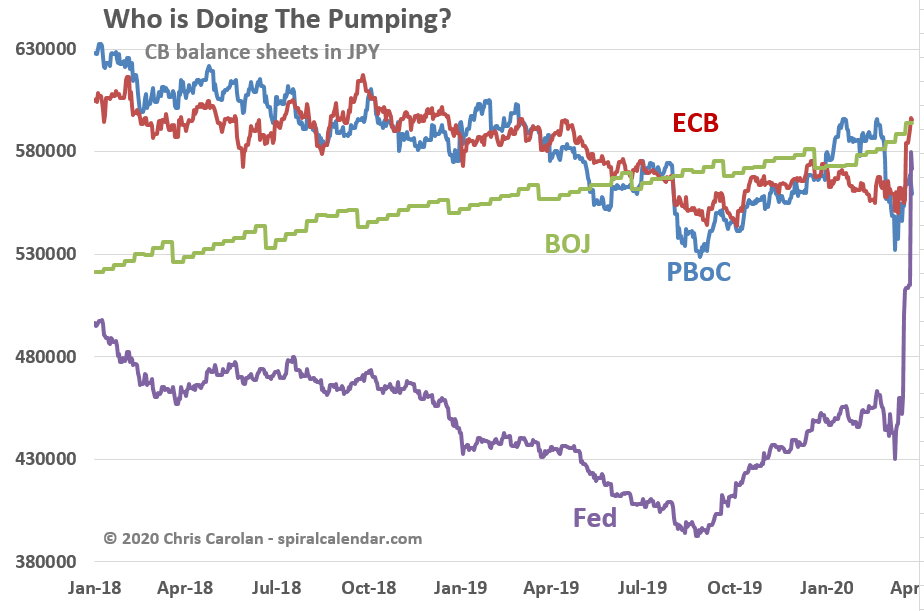
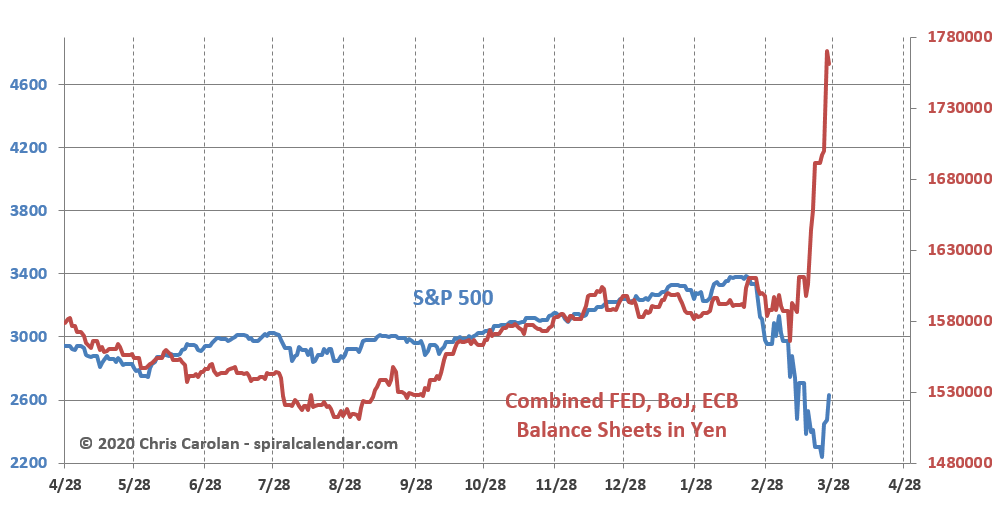
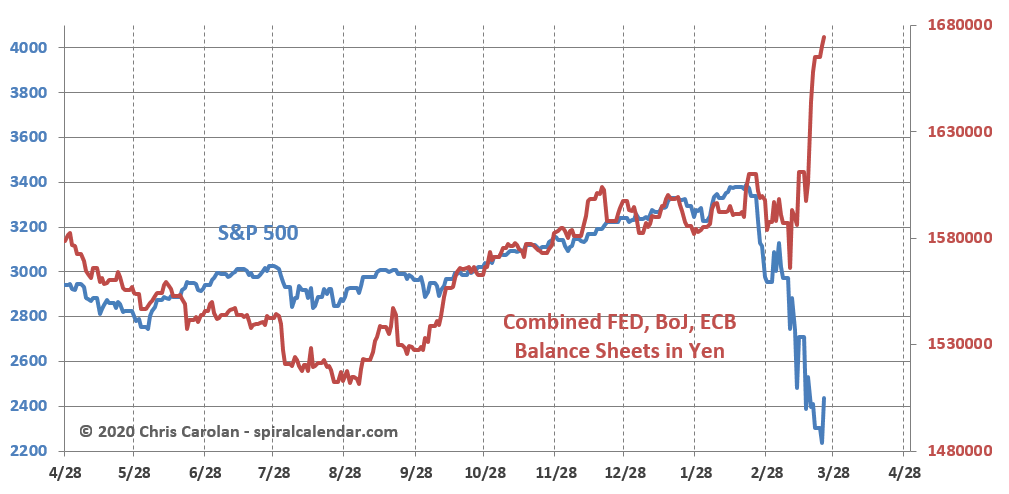
click chart to enlarge Do not underestimate the pull of the balance sheet on asset prices even as a depression unfolds.

click chart to enlarge