The Question
In what way did the 1987 stock market crash most closely resemble the 1929 crash? With the answer to this question I have formulated a method for forecasting periods of extreme emotional human behavior. These periods often occur at a time when markets, such as those for stocks or commodities will change direction. This method is also applicable to mass human behavior in other areas such as political movements and trends. There are additional implications of my research, namely, the cause and structure of the larger forces that create the patterns of life and growth in the affairs of men.
Before I examine the question that led to all of these ideas, I will explain why I asked that question at all. In 1987, I was a stock option trader on the Pacific Exchange in San Francisco. There I stood in a “pit,” a conglomeration of humans who often behaved more like beasts, hungry for a dollar, competitive, greedy. People yelled and screamed for any advantage available. Survival of the fittest was the accepted rule. In this environment many decisions are instinctive, intuitive or emotional. The conventional wisdom explains the movements of the markets as logical reactions or progressions of the latest economic insight or data bit, but the view from the pit is different. The “crowd” divides into buyers and sellers and the pit is where they meet. Their energy is like electric potential with two polarities. The trades are the sparks that jump the gap. Traders react by “feel.” Sometimes this is an advantage, and yet when emotions prevail, it is a handicap. With time spent in a pit comes the ability to sense the pulse of the crowd. The most dramatic event for a trader to witness is the sudden and complete conversion of the crowd from buyers into sellers or vice versa, an event that occurs at important market turns. I frequently witnessed prices moving quickly in one direction while the commentary of the crowd cheered on. Prices accelerate and the commentary becomes even more definitive. “They’ll never go down!” traders shout. Then, prices reverse and move just as determinedly in the other direction. The mood of the crowd has changed. They are convinced they have seen an important juncture in the market. Their change of heart is not a reaction to the change in the market, but rather a simultaneous occurrence. These are traders who, individually, will tell you they are behaving with logic and reason, yet will have a consensus opinion and then all change that opinion together as if on cue. It is like watching a flock of birds flying in tight formation simultaneously reverse direction together. This is not how all markets behave at all times, but it is most evident in times of extreme emotion.
I was a six year veteran on the trading floor in late 1987 when the crash occurred. My own interest in observing the emotions of traders was sharpened by the single most extraordinary event in the lives of most current market participants. Here was emotion so great it was called a “panic,” the first seen by my generation. It happened not just in one pit but in many pits, not just on one exchange but on many exchanges, not just in the U.S. but worldwide. Fear, panic and despair gripped millions simultaneously. Why?
This was not a unique event. It had happened before, most recently in 1929. In 1987, some had seen parallels to 1929 before the crash and had profited handsomely. After the crash, newspapers were full of charts comparing 1987 and 1929. Figure 1-1 compares the Dow Jones Industrial average for these two years. This chart shows all of 1929, January through December, compared to same period in 1987. The comparison is amazing. Many analysts were captivated by the relationship between those two years until the markets stopped following the same path. The subsequent years, 1988, and 1930, were not similar. Yet the fact remains that the pattern traced by prices in 1987 followed step for step what had occurred fifty-eight years earlier. When you look at these two charts, consider that they reflect a pattern created by the behavior of a group of individuals and that each individual has the free will to buy or sell on any given day and that these groups of individuals are separated by more than a generation. Yet the patterns are similar. Why? How?
 fig 1-1 Pattern or Coincidence?
click to enlarge
The Similarities
There are four marked similarities in the charts of the two years. These four points give the comparison of the two charts their striking resemblance.
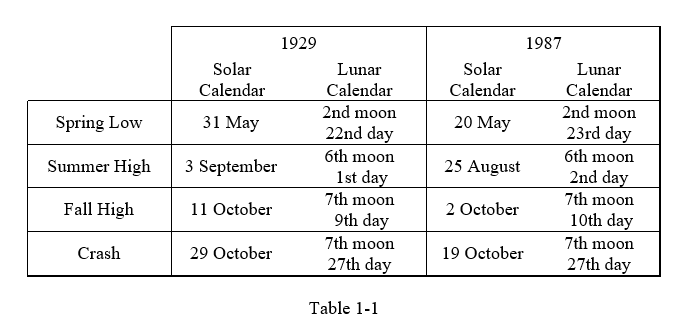
- Both markets had a small correction that ended in late spring; May 31 in 1929, and May 20 in 1987.
- Sharp rallies in both markets peaked in late summer; September 3, in 1929 and August 25, in 1987.
- Both markets attempted rallies in the early fall, which failed to exceed the summer peaks. In 1929 the lower peak was on October 11, in 1987, it was October 2.
- The crashes occurred in October. The 1929 crash was October 29. The 1987 crash was October 19.
Each of these four points on the 1987 chart falls nine to eleven days earlier then the same point on the 1929 chart. While these analyses point out the similarities of the two charts, it is also evident that they are not strictly the same.
Now it is time for some detective work. What are the strengths and weaknesses of this analysis so far? Figure 1-1 is a chart of the two years we are comparing. The chart is interesting, but how is it made? There are three pieces of data that are critical to the appearance of Figure 1-1. Two of the pieces are obvious, the sets of stock price data for 1929 and 1987. The third is not readily apparent, but it is crucial to the appearance of Figure 1-1. It is the calendar that determines how the two other data sets align. The chart shows the first day of trading in 1929 aligned above the first day of trading in 1987, etc. By aligning both charts at the beginning of the year we are using the calendar as the yardstick of comparison. That the similarities in the charts occurred at the same time of year is what makes it most interesting. If one crash had occurred in March and the other in October, the shape of the charts may still be similar, but the comparison would no longer be as striking. The similarity in the two charts is greatly a function of the calendar. The examination of the exact dates of the similarities also uses the yardstick of the calendar as the absolute against which conclusions are drawn. The questions I wanted answered were, “Is this calendar the proper yardstick?” and “What would happen if the two years of trading data are compared with some other method of counting time?”
On Calendars
The calendar we use is the Gregorian calendar. It is an improved version of the Julian calendar named for Julius Caesar. Our calendar, with its Roman origin, does a very good job of keeping time. The time it keeps is solar time, the rotation of the earth around the sun once every 365.25 days. There are other units of time a calendar could use. Ancient calendars usually measured the time it takes for the moon to circle the earth relative to the sun. Most calendars measure one type of time accurately and then approximate the other type of time. Our solar calendar approximates lunar time with its month but it is an inaccurate measurement of lunar time. To distinguish between the modern month which is 1/12th of a solar year and the ancient month that was one moon, I will use the term “moon” for the ancient month and use month in its present context as a fraction of a solar year.
 click to enlarge
 fig 1-2 The two markets aligned with a lunar calendar.
The Jewish calendar is a lunar calendar still in use to mark religious holy days. One of the holy days, Yom Kippur, in 1987 fell exactly on the third point of the four market similarities, the fall market top. There is an old stock market adage, “buy on Rosh Hashanah, (another holy day), sell on Yom Kippur.” Selling stocks on Yom Kippur in 1987 was a very good thing to do. My desire to know when Yom Kippur fell in 1929 was the original impetus for my calendar investigations. The Jews borrowed their calendar from the Babylonians. A partial history of ancient calendars is explored in Chapter 8. In the Jewish calendar, the new moon is the first day of the moon cycle (month). The new moon near the spring equinox marks the first day of the first moon of the year. With this calendar I realigned the comparison of the 1929 and 1987 stock charts. The result is Figure 1-2. Shown also are the four points of similarity. Table 1-1 shows the lunar and solar dates for the same four points. The crash of 1987 occurred on the same lunar date as the crash of 1929! The other three points each fall one day later on the lunar calendar than their 1929 counterparts. Within one day, the 1929 autumnal market top occurred on the Jewish holy day of Yom Kippur.
Could this be a coincidence? There are 354 days in a lunar year, 29.5306 days per moon times 12 moons. The 1987 crash could have occurred on any one of those 354 dates in the year, but it occurred on the same date as the 1929 crash. That’s a 1 in 354 chance! Add to that the odds of the other three points falling on the same date plus or minus one day. They’re very remote. It’s more likely that you and I both win the lottery. I undertook this investigation on the belief, born in the experience of trading during the crash, that it was not a random event. The eerie parallels to 1929 spurred my curiosity. Now, here was a link between the two markets that was absolute and dramatic. In solar terms the 1929-1987 analogy was an intriguing coincidence. Now seen in lunar terms, the likeness is an empirical fact. Where there was similarity, there is now sameness. What appeared as a resemblance is revealed to be a replication.The Jewish calendar is a lunar calendar still in use to mark religious holy days. One of the holy days, Yom Kippur, in 1987 fell exactly on the third point of the four market similarities, the fall market top. There is an old stock market adage, “buy on Rosh Hashanah, (another holy day), sell on Yom Kippur.” Selling stocks on Yom Kippur in 1987 was a very good thing to do. My desire to know when Yom Kippur fell in 1929 was the original impetus for my calendar investigations. The Jews borrowed their calendar from the Babylonians. A partial history of ancient calendars is explored in Chapter 8. In the Jewish calendar, the new moon is the first day of the moon cycle (month). The new moon near the spring equinox marks the first day of the first moon of the year. With this calendar I realigned the comparison of the 1929 and 1987 stock charts. The result is Figure 1-2. Shown also are the four points of similarity. Table 1-1 shows the lunar and solar dates for the same four points. The crash of 1987 occurred on the same lunar date as the crash of 1929! The other three points each fall one day later on the lunar calendar than their 1929 counterparts. Within one day, the 1929 autumnal market top occurred on the Jewish holy day of Yom Kippur.
Consider that the stock market chart of each year is a pattern or design created by hundreds of thousands or millions of people by their economic behavior through time. It has long been a wonder of nature to watch birds migrate or salmon return to spawn. They miraculously recreate their ancestors’ patterns in minute detail without conscious knowledge of their actions. Here is evidence of the same activity in humans. In 1987, traders and investors danced to the same tune of speculation and panic that had played fifty-eight years earlier. Here also is the evidence of what was playing the tune that led those dancers. The phases of the moon provided the rhythms of greed and fear by which they bought and sold.
It was 1988 when I made the discovery of the lunar connection between the crashes. I understood immediately that this was an important advance in the understanding of both markets and man. However, it does not provide a method for forecasting market behavior by itself. It was a clue to the market’s mechanism, and it pointed the way to where I should look for further discoveries. It was some months before I made further progress. Most of those months were spent looking at that same pair of charts in Figure 1-2, one year positioned above the other, like a photograph of siblings; and I knew who the parent was on the other side of the camera, Luna.
It is not a new idea that the position of the moon and sun in the sky have influence on the behavior of man. In the West, it is traced to the Mesopotamians of 5000 years ago. To modern man, the idea is on the fringe of accepted knowledge, supposedly lacking “proof.” I submit the extraordinary relationship in lunar time of the stock markets of 1929 to 1987 as the first brick in a wall of proof I will construct. Notice also that it is when seen through the calendar of those same Mesopotamians that the evidence is made plain. The Mesopotamians will receive their full due in Chapter 8.
Why 1987?
The question I needed to answer was, “Why did the speculation and crash of 1987 happen then and not in some other year?” My knowledge of the lunar relationship gave me no clue to that answer. I slowly came to understand that the chart I was looking at was not pointing me towards the next piece of the puzzle. I was looking at 1929 and 1987 as isolated years. I needed to look at the entire time span of stock price movements. It was the interval of time in between that was the key. Before, I focused on each of the four points being at the exact same lunar calendar point. Now I saw the similarity in a different way.
 Fig 1-3
The distance in time from the spring low of 1929 to the spring low of 1987 was the same as the distance in time from the 1929 top to the 1987 top. This was also the same as the distance from the 1929 fall peak to the 1987 fall peak and again the same as the distance from crash to crash. The two years had to be seen in a different way to be understood. This time span also needed a fresh perspective. It wasn’t important that fifty-eight years separated these charts. It wasn’t important how many days separated these charts. Weeks and months also weren’t relevant. The question was. How many moons separated these events? See Figure 1-3 and Table 1-2.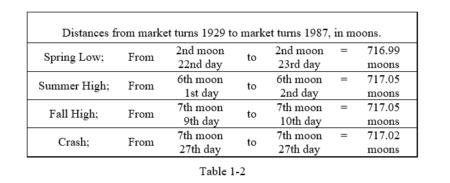
Each event in 1987 occurred approximately 717 moons from the analogous point in 1929. The average of the four distances is 717.03. I felt that if there were a larger pattern to be found, this number should turn out to be significant. My first inclination was to check if it was a Fibonacci number. I first learned of Fibonacci numbers in high school. I next encountered them and the related golden section in my collegiate studies of ancient art and architecture. My third experience with Fibonacci numbers came through the work of R.N. Elliott and Robert Prechter and their analysis of the stock market. Yet 717 is not a Fibonacci number. I wondered if 717 might be some permutation of a Fibonacci number, maybe a multiple or a square root. With calculator and pencil in hand I proceeded through the sequence of Fibonacci numbers. When I entered the 29th Fibonacci number, 514,229, into the calculator and pressed the square root button — there was 717.0976. My first thought then is still very clear in my memory: “The world is a very beautiful place.”
This was the second discovery my detective work had produced. These discoveries are empirical facts linking the two great financial panics of this century with concrete external phenomena, moon phases and Fibonacci numbers.
The next two chapters will take us away from the main topic, forecasting emotional market behavior, in order to obtain a foundation of knowledge about the moon and Fibonacci numbers. This is necessary for the ideas that will follow.
© 1992 Christopher Carolan, All Rights Reserved.
The Spiral Calendar is available on Amazon.