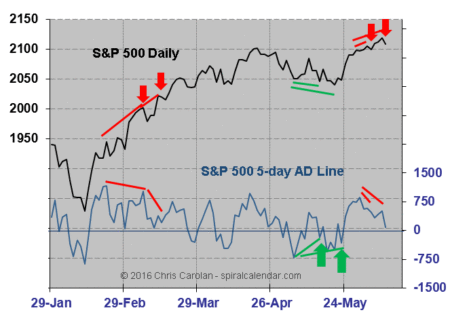
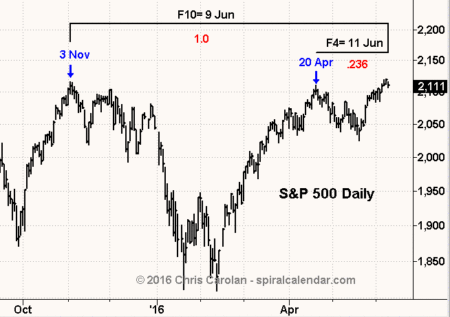
Add up to a sell now.
click chart to enlarge
click chart to enlarge
Unfolding perfectly here.
click chart to enlarge
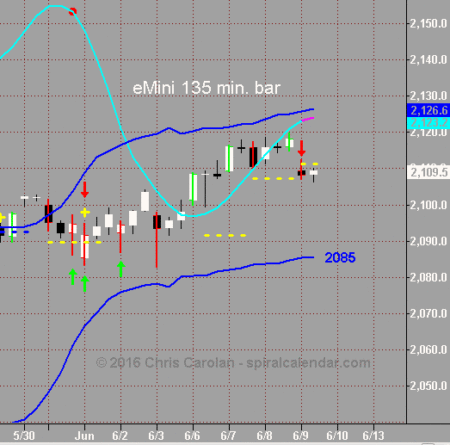
The intraday 135-minute RTH eMini chart issued a net-line sell this morning. The target is now at 2085.
click chart to enlarge
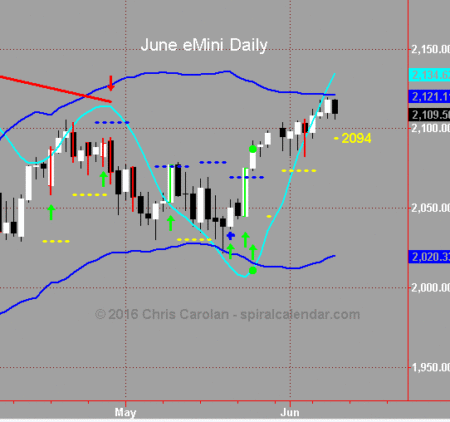
If that 2085 target is reached in the next few days, it implies a likely trigger of the 2094 daily net-line. A confirmed sell on the daily will target 2020, or a 4% decline from current levels.
click chart to enlarge
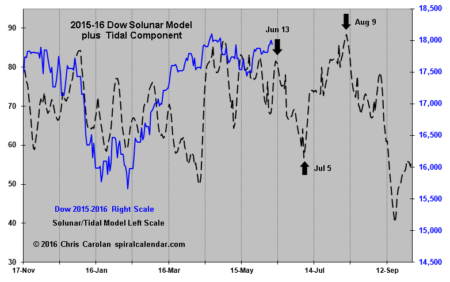
The combined Solunar/Tidal is a few days away from a very negative, three-week period.
