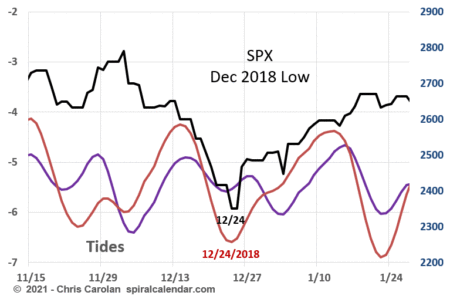
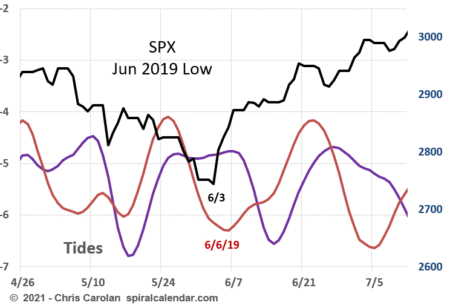
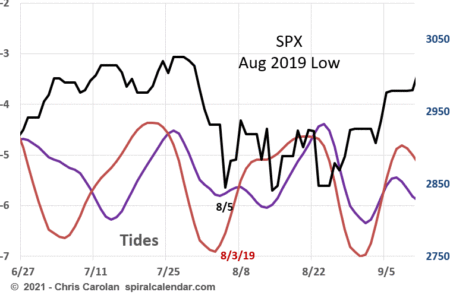
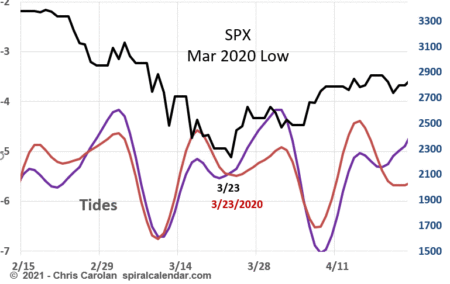
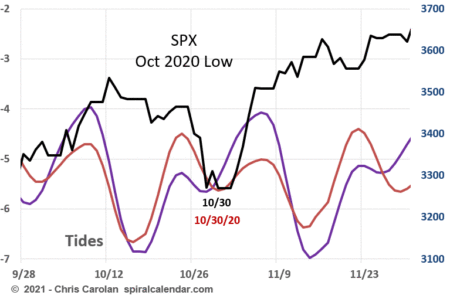
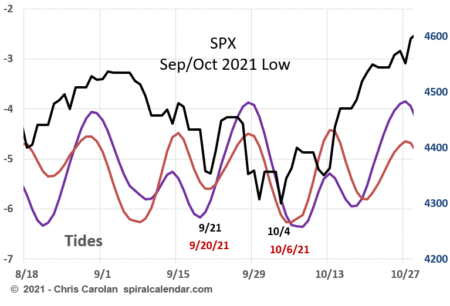
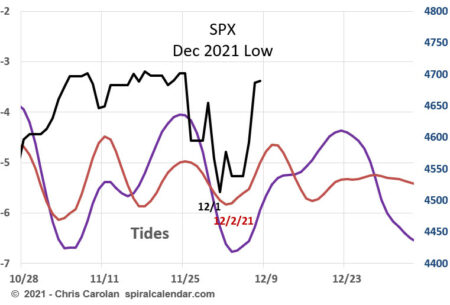
Here are charts showing tidal cycles at seven important lows over the past three years. The tidal charts show the drop in feet for each of two daily tides at Reedy Point DEL on the U.S. East Coast. The troughs in the charts are the higher tides (larger drops.) The two daily tides have an equal value when the moon crosses the equator.
Draw your own conclusions.
click chart to enlarge
click chart to enlarge
click chart to enlarge
click chart to enlarge
click chart to enlarge
click chart to enlarge
The March and October 2020 lows are twins. Notice the nearly identical tidal rhythms. There is symmetry to an extent between Spring and Autumn tidal cycles.
click chart to enlarge
A double bottom, The VIX extreme was at the first low.
click chart to enlarge
