I want to share a few tidal charts today to shed some light on how tides work and some of the evidence for their importance.
click chart to enlarge
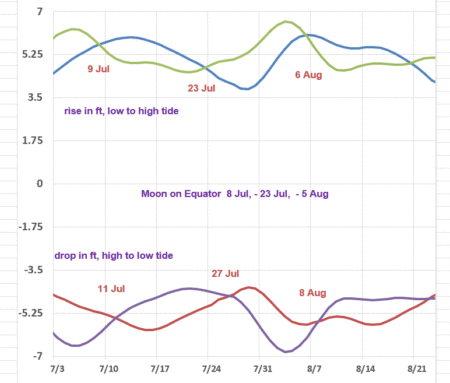
First chart shows how I display tidal data. The drop from high to low of the two daily tides is shown.
Ricardo asked a good question in the subscriber area.
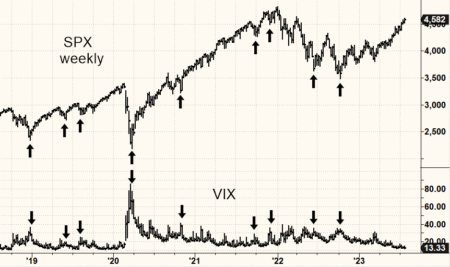
“The VIX Log graph, I observe when there is a cross between the Neap Tide (red) and Spring Tide (purple) a change in trend is observed, is my appreciation correct, or is it just a coincidence?”
The two daily tides produce four measurements, the two drops from high to low, and two rises from low to high. I choose to use the drops to represent the tides. The chart below shows all four pieces of data for the current period. The daily tidal values are roughly equal when the moon is on the equator. But there is a delay. Water sloshes around and that takes time. You can see the crossovers are not the same as the actual date the moon is on the equator and the dates are different at this time for the tidal rises compared to the drops.
I think the moon’s rise and fall above the equator is a piece of the puzzle, but I haven’t found a specific relationship.

click chart to enlarge
On to some evidence. The subscriber area has much evidence of late linking new moons and neap tides with lows in the VIX. Here I’d like to present relationships between market bottoms and spring tides.
click chart to enlarge
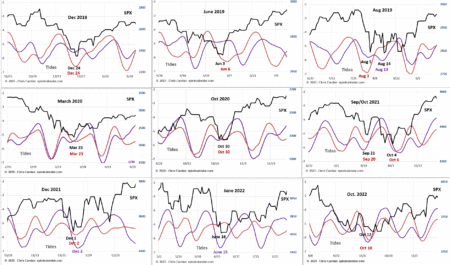
The above chart shows nine market lows and their corresponding VIX tops from the December 2018 low through 2022.
click chart to enlarge
The above shows how each of these nine bottoms formed on spring tides. Powerful stuff.
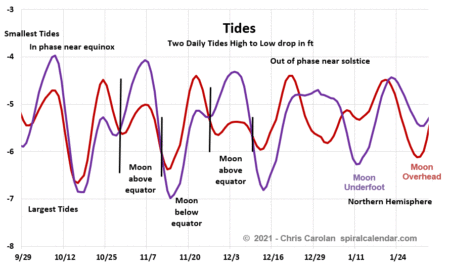
This chart shows the tides for 2020. Notice how the tides are similar six months apart. Not the same, but similar. Notice how the March and October 2020 lows formed in identical tidal structures. I talk often about emotional market events being echoes of previous events. The October 2020 low was an echo of the earlier, and very emotional March 2020 low.
The chart also nicely shows how the two daily tides move in and out of phase as they progress across the equinoxes and solstices.


You touched on a possibility:
Lunar Declination. On 9/5/1929 it was at max. I think it is again on 9/8/2023.
Off the financial topic, but you might find Chapter 4 of ‘Climate Change The Facts’ of interest, ‘The Role of The Moon in Weather Forecasting’.