Who’s On First?

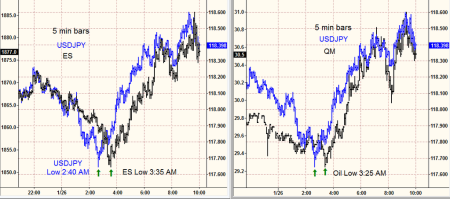
After seeing a few too many tweets stating that the oil market is leading this highly-correlated dance, I investigated last night’s sharp reversal and found it was dollar yen, not crude oil that set the trend.

yen2

click chart to enlarge

yen

click chart to enlarge

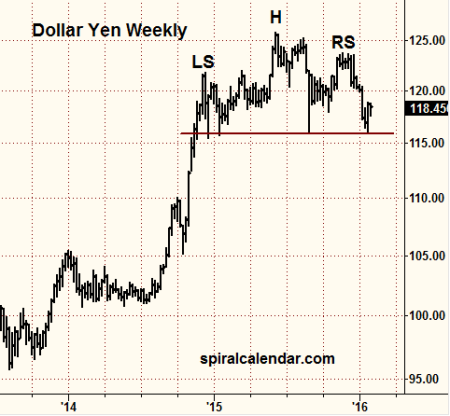
If world financial markets are depending on dollar yen now, we are in for some trouble, as the above long-term, as yet unconfirmed, head-and-shoulders formation on dollar yen shows.

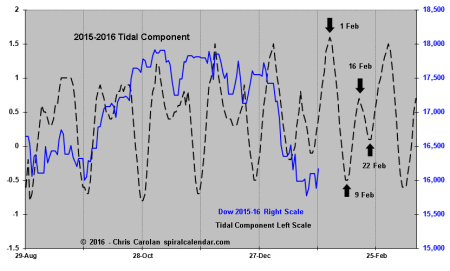
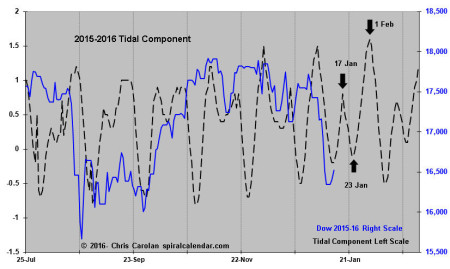
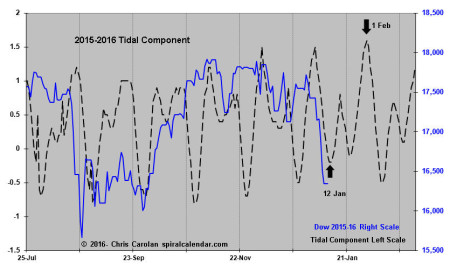
012616tides

click chart to enlarge

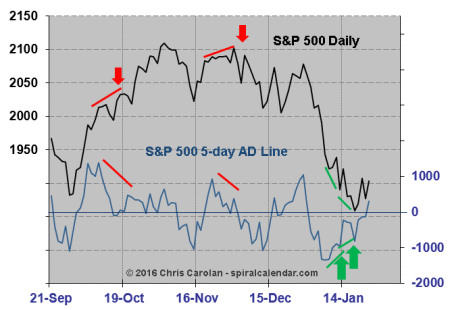
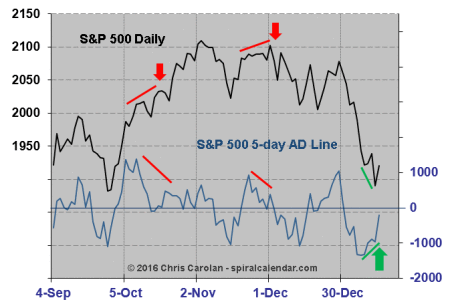
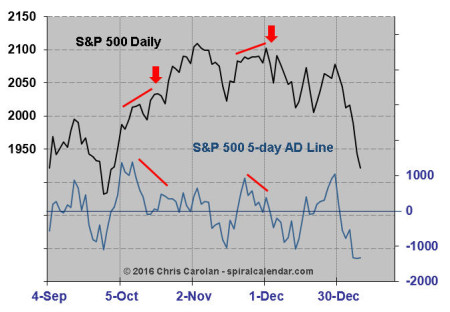
012616spxAD

click chart to enlarge

Continue reading Who’s On First?

Fearless

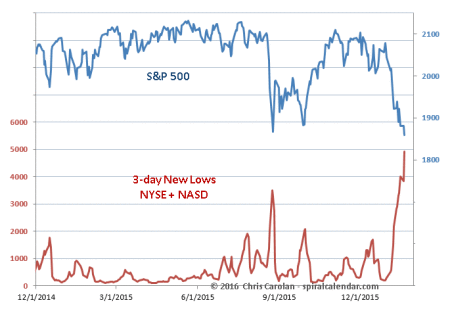
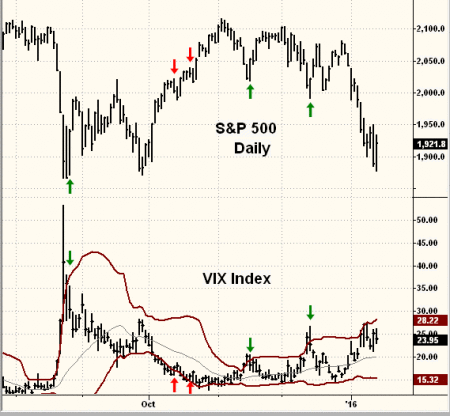
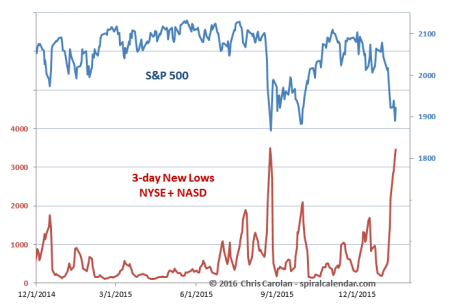
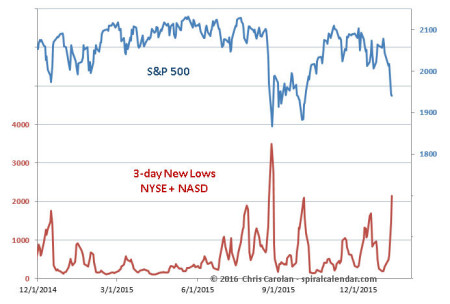
The lack of fear (VIX)  at the low, despite great technical damage (new lows), leaves  me a non-believer in the bull case here.

011416vix

click chart to enlarge

011416newlows

click chart to enlarge

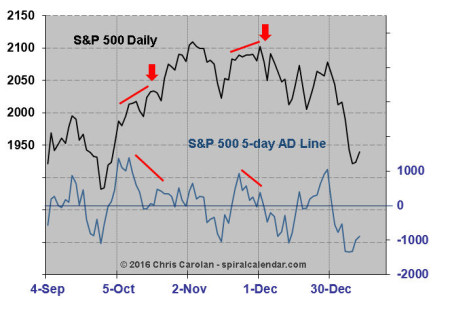
011416spxAD

click chart to enlarge

The S&P 500 AD oscillator might be the best argument for the bulls.

Solunar Model charts and a video wrap-up within for subscribers.

Subscribe to see the rest of this post.

Weekly NotSoUp Date

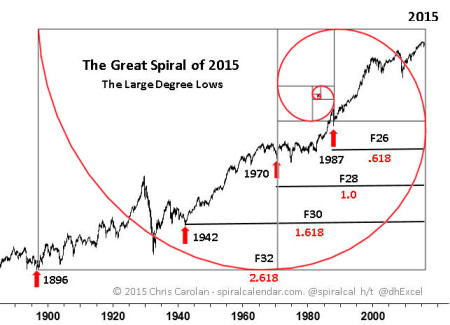
We are at one of those junctures where the Spiral Calendar gives us a huge advantage over other participants. We have the unique perspective now of understanding the true (and large) degree of this decline.

011016newlowsclick chart to enlarge

011016spxAD

click chart to enlarge

010610tidal

click chart to enlarge Tidal forces are friendly this week, but not so much the Dow Solunar Model (inside for subscribers.)

Subscribe to see the rest of this post.

Three Pairs

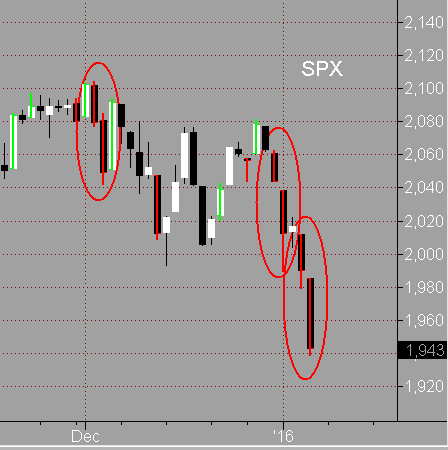
The S&P cash has generated three pairs of range bust bars since the early December top. Two of these pairs are are in the past four sessions. Range bust pairs are signs of acceleration. That we now have three of these on the recent chart is consistent with the beginning of a large degree move.

rangebustpairs011716

click chart to enlarge

Subscribe to see the rest of this post.