At some point the strong dollar will hurt.
click chart to enlarge
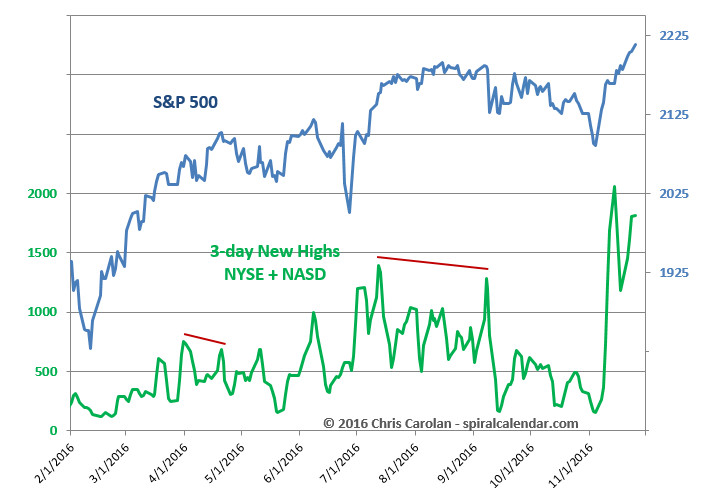
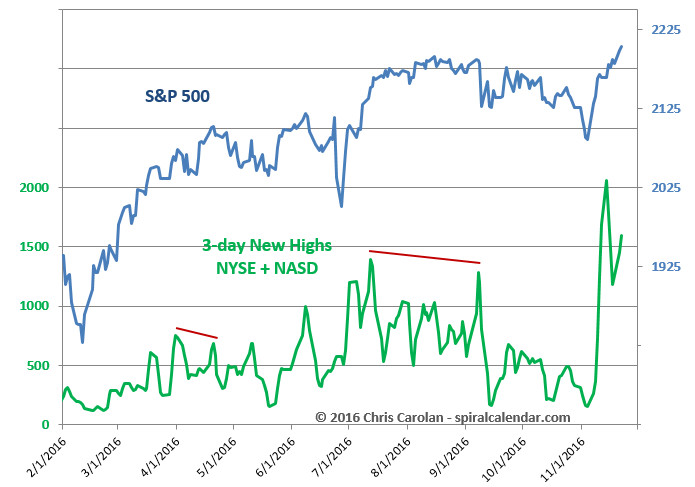
click chart to enlarge Divergence forming.
click chart to enlarge
click chart to enlarge
click chart to enlarge Divergence forming.
click chart to enlarge
click chart to enlarge
click chart to enlarge
click chart to enlarge

click chart to enlarge What if dollar yen was priced according to relative central bank balance sheets?
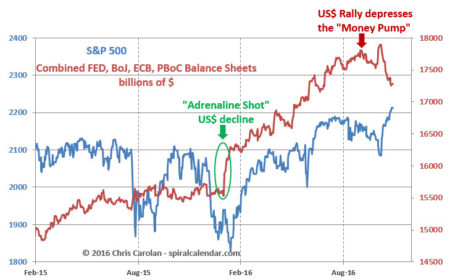
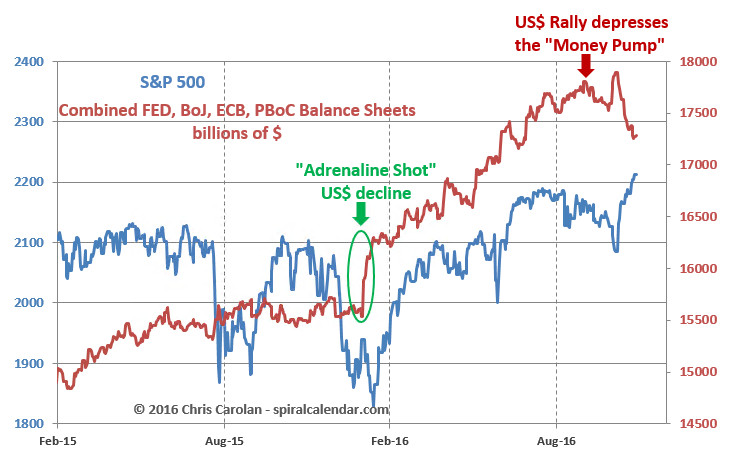
click chart to enlarge The Dollar Rally, be careful what you wish for.
click chart to enlarge
click chart to enlarge
Take a deep breath, everybody.
click chart to enlarge Peaked
click chart to enlarge Deteriorating.
click chart to enlarge
click chart to enlarge

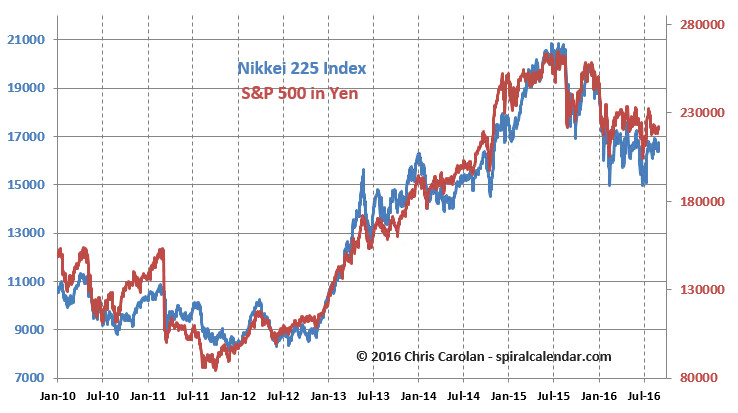
click chart to enlarge The S&P has re-synced with the Nikkei, closing the recent lag.
click chart to enlarge Gold says dollar yen higher.
click chart to enlarge Relative balance sheet size says dollar yen much higher.
click chart to enlarge
However, dollar strength depresses the balance sheet money pump denominated in dollars. A problem for stocks later.
click chart to enlarge

click chart to enlarge

click chart to enlarge
click chart to enlarge
click chart to enlarge I mentioned early last week that the dollar decline was re-inflating the Money Printing Pump and setting the stage for the next advance.

click chart to enlarge
click chart to enlarge
click chart to enlarge
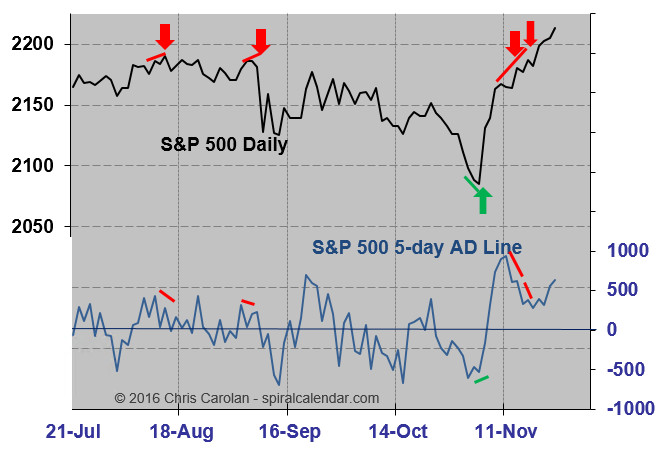
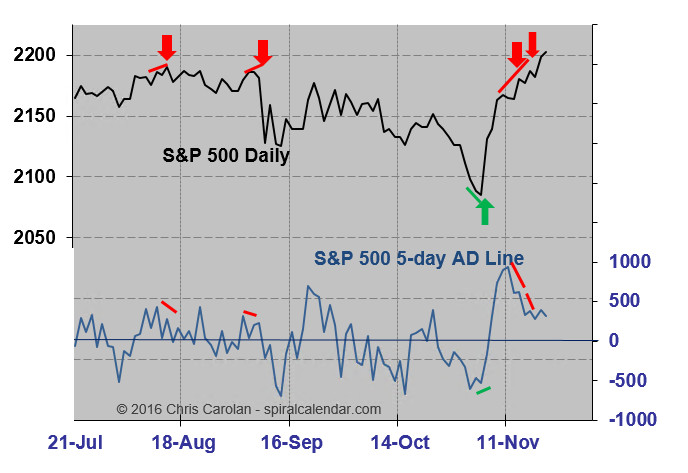
click chart to enlarge Small bullish divergence confirmed today.