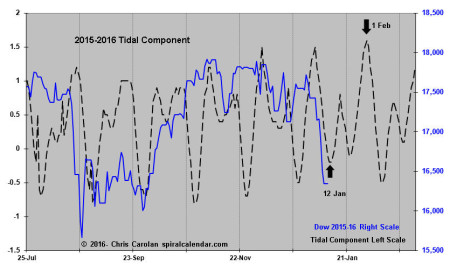
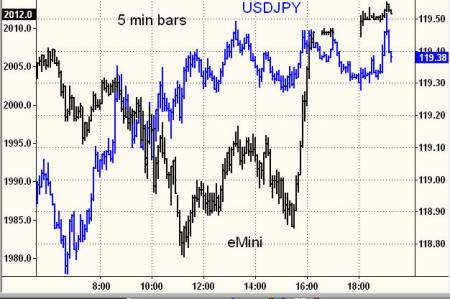
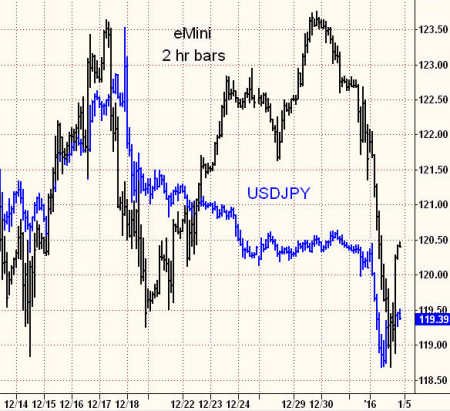
Updated Solunar Models Solunar Model charts inside for the Dow, Gold, Oil and 10 yr Yields. The Solunar Model is a seasonal model that accounts for both the position in the solar year, as well as the lunar month. Subscribe to see the rest of this post.
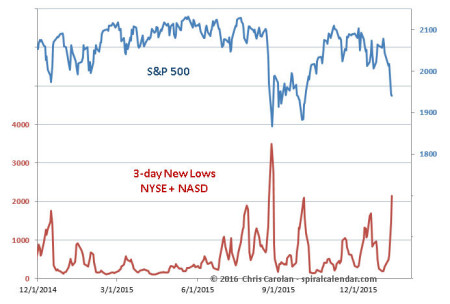
Not Quite Right Weak oil prices are likely behind the surge in new lows. Regardless, it's not a healthy sign. click chart to enlarge click chart to enlarge click chart to enlarge Relative Central Bank Balance Sheets Drive the Currency click chart to enlarge Currency Drives Equities Subscribe to see the rest of this post.
Imperfect But Useful That's a good description for most indicators, isn't it? click chart to enlarge Subscribe to see the rest of this post.
Weekly Update The holiday week is historically quiet and bullish. Monday's trading should let us know if anything different can be expected. Subscribe to see the rest of this post.
Quiet into the New Moon The eerie calm right before the new moon has me alert for a possible top now. Subscribe to see the rest of this post.
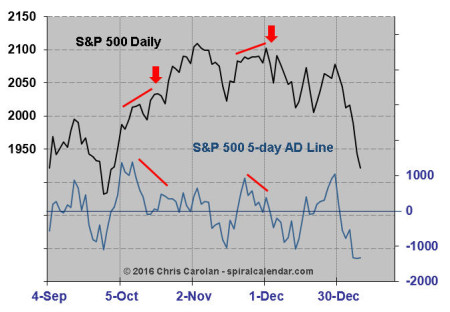
Deteriorating & Quiet A calm before the storm, perhaps? click chart to enlarge Subscribe to see the rest of this post.
More Metals Is the gold and silver genie finally out of the bottle? Subscribe to see the rest of this post.