I first started publishing charts comparing CB asset levels with equity prices in 2010. This latest chart zooms in on the "Money Printing Pump" for the past few months. It is important to understand that CB balance sheets in dollar terms are sensitive to exchange rates. A weaker dollar inflates balance sheets, a stronger dollar depresses them. In recent weeks stocks have become "locked in" to the fate of the Money Printing Pump. The dollar has to continually weaken to keep the game going at this point. A dollar rally will torpedo the equity market.
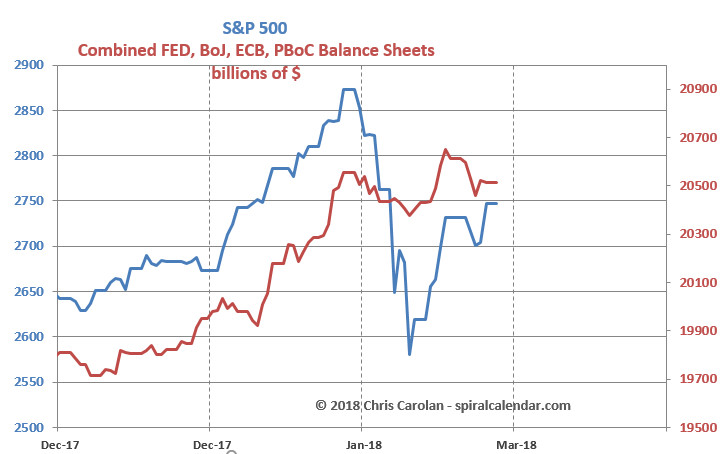
click chart to enlarge

click chart to enlarge
Solunar and tidal charts as well as a video discussion of daily and weekly candle charts is inside.