click chart to enlarge
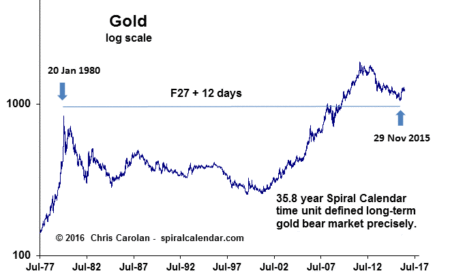
The long-wave bear market ended in November 2015, defined perfectly by the Spiral Calendar.
click chart to enlarge
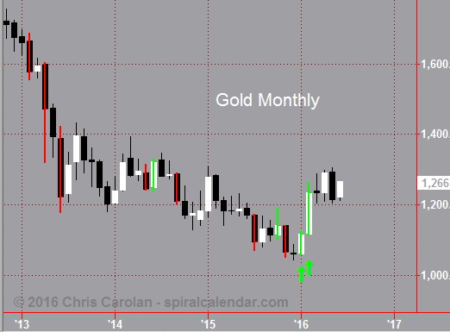
The pair of consecutuve range bust acceleration bars on monthly chart is very strong long-term signal.
click chart to enlarge
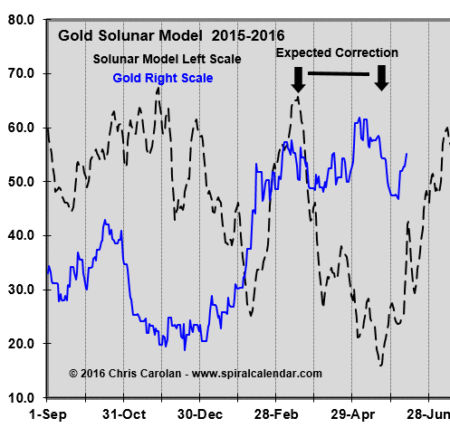
Solunar Model seasonals have turned positive.
click chart to enlarge
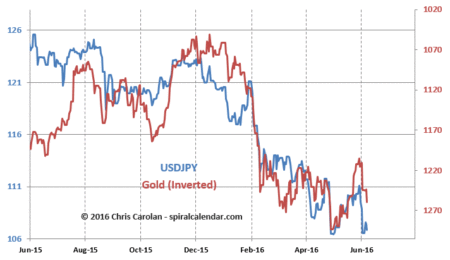
Gold lags dollar yen.
click chart to enlarge
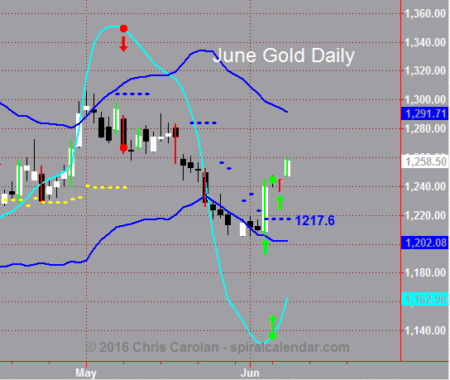
Three buy indications within a span of three bars on the daily chart.
