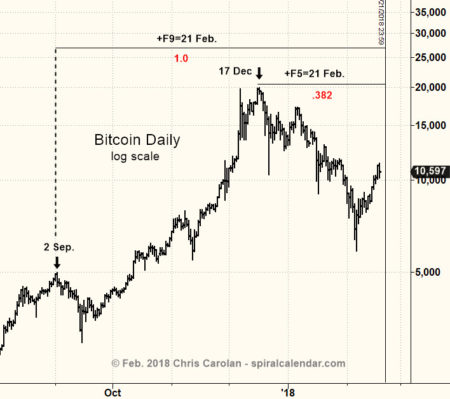
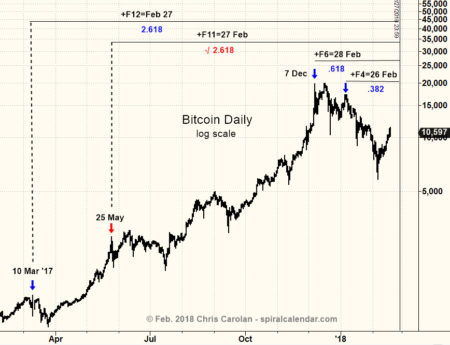
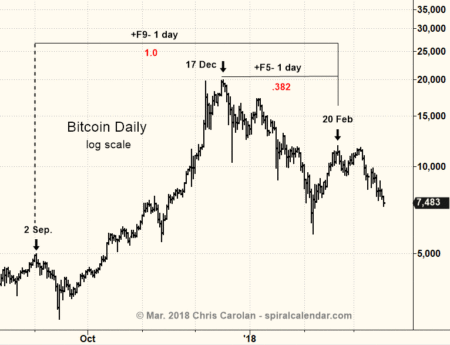
The February 18 update contained two Spiral Calendar charts for bitcoin.
click chart to enlarge
click chart to enlarge
The first chart was a direct hit, with the bitcoin high of February 20 still standing, although it looked like it was going to succumb two weeks ago. The second SC date was a non event.
click chart to enlarge
There’s one Spiral Calendar relationship coming up worth watching now…
click chart to enlarge
Here’s a potential bitcoin low for April 7-8, plus or minus another 2 days. It’s interesting that this relationship is of larger degree than the just completed spiral. Don’t count on this being a low, but if prices show extreme selling in this time window, expect a reversal.


