Comparisons Are Odious

Some bitcoin thoughts.

click chart to enlarge

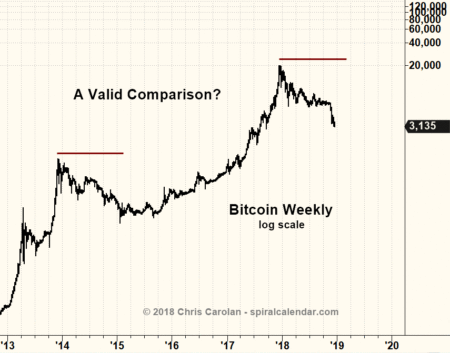
The majority of the 'bitcoin is going to new all time highs' reasoning I see shows some version of the chart above remarking on the comparability of the 2013 and 2017 highs and the similar extent of the subsequent declines.  The "analysis" concludes that bitcoin has recovered from similar before and will again.   Easy peasy.

click chart to enlarge

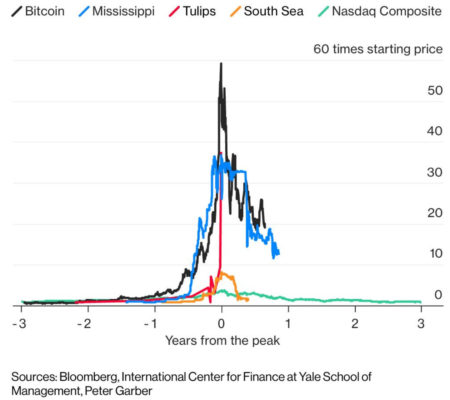
The fallacy here is that the 2013 top was not a mania and the 2017 top was a mania. The 2017 bitcoin top is the largest mania known to recorded history (until and unless some Assyrian tablets from Nineveh get found) see the above chart from Bloomberg. The 2013 bitcoin top does not appear on any lists of manias.  

click chart to enlarge

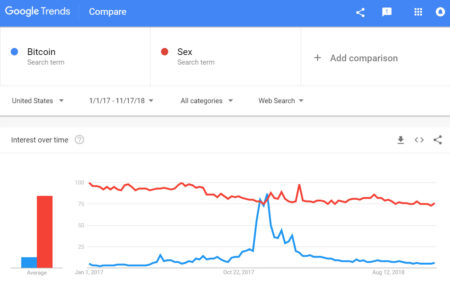
For a few short days in late 2017, "bitcoin" was more searched than "sex" on google.   Yes, bitcoin was bigger than sex. That's what mania's do.   What manias don't do is come back and become even bigger manias. Bitcoin's 15 minutes of fame were bigger than most. It was bigger than sex.  But it's not going to 10 times sex just because the 2014 and 2018 bear markets look similar on a chart. Timing ideas inside.

Subscribe to see the rest of this post.

Bitcoin & the Spiral Calendar.

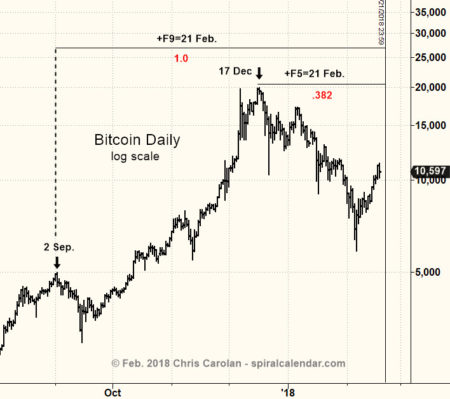
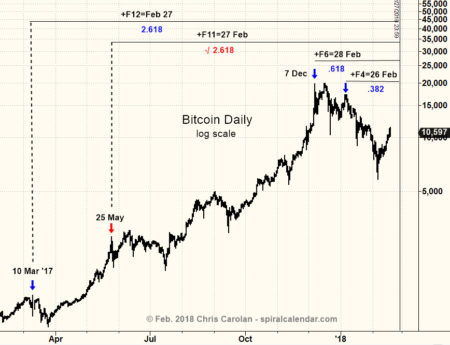
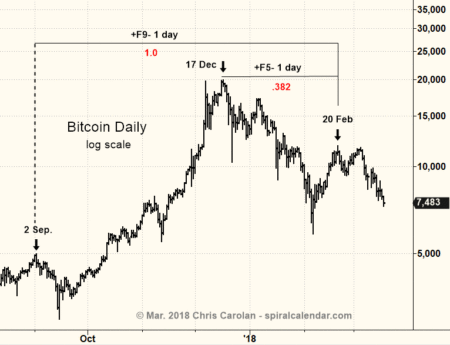
The February 18 update contained two Spiral Calendar charts for bitcoin.

click chart to enlarge

click chart to enlarge

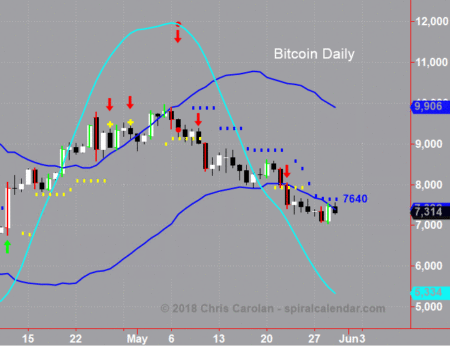
The first chart was a direct hit, with the bitcoin high of February 20 still standing, although it looked like it was going to succumb two weeks ago.  The second SC date was a non event.

click chart to enlarge

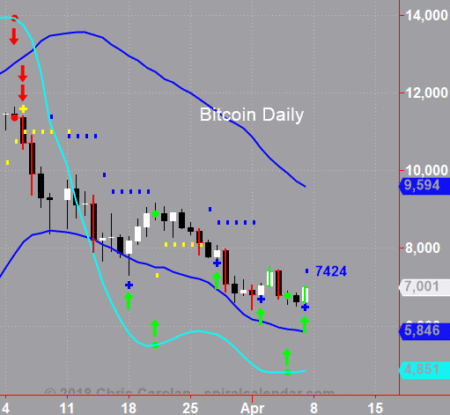
There’s one Spiral Calendar relationship coming up worth watching now…


click chart to enlarge

Here’s a potential bitcoin low for April 7-8, plus or minus another 2 days. It’s interesting that this relationship is of larger degree than the just completed spiral.  Don’t count on this being a low, but if prices show extreme selling in this time window, expect a reversal.