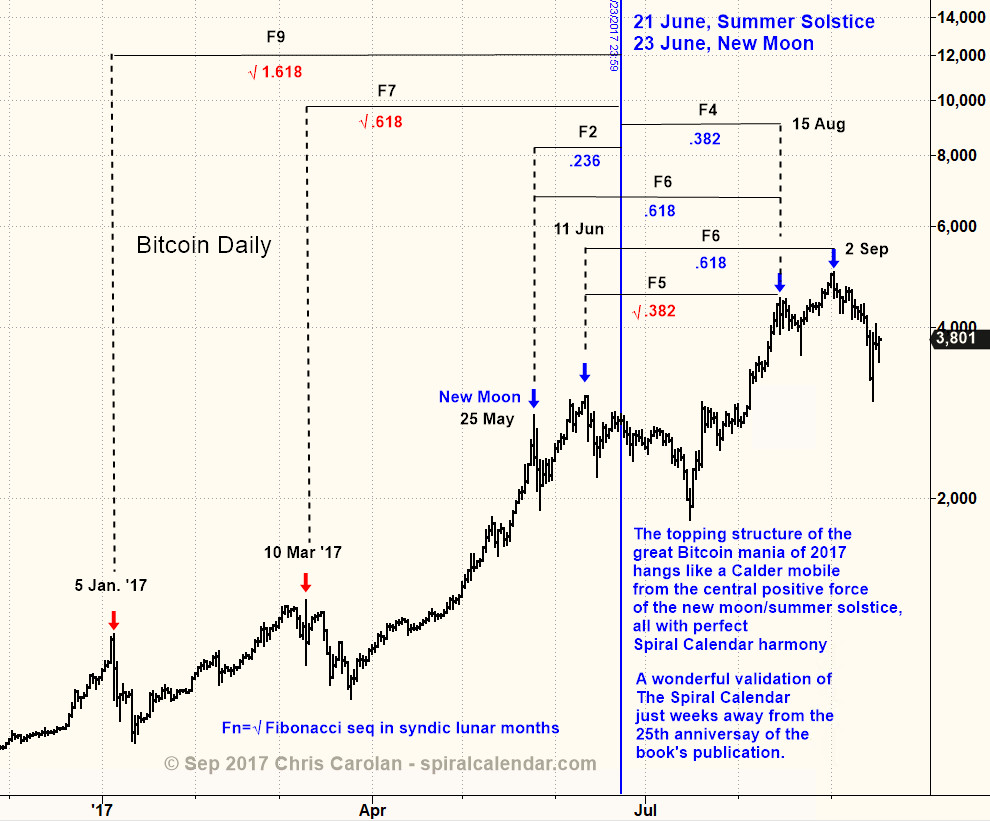
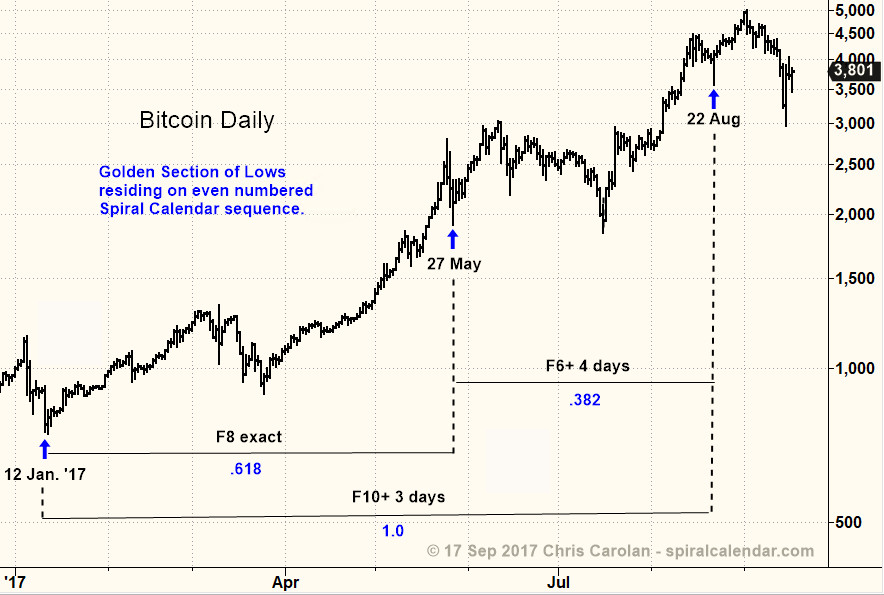
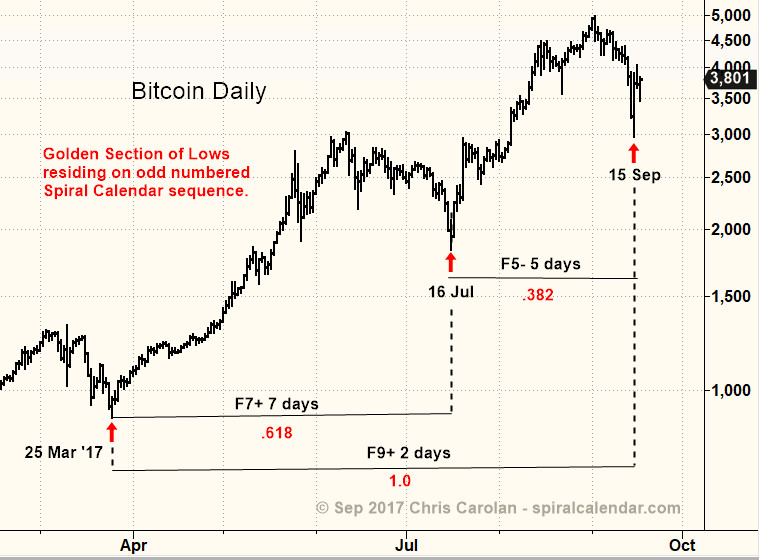
The Spiral Calendar & Bitcoin.

The premise of The Spiral Calendar is that fixed time periods derived from Fibonacci and lunar periods defined the emotional content of market prices.  In recent years, as external forces, Central Banks primarily controlled asset levels with massive money printing, the Spiral Calendar has been rendered nearly irrelevant. During this period I have tracked that correlation between Central Bank money printing and rising asset prices. And then along came Bitcoin. Bitcoin presents a market that is nearly pure emotion. Devoid of "valuations" and influence from traditional financial instutions. There are some large players pushing things around, so-called "whales", early adopters with huge inventory. The percentage moves in bitcoin, and related crypto-currencies have been huge.  The nearly pure emotional content of price action would seemingly be a prefect laboratory for Spiral Calendar analysis. A real life petri dish to test the hypothesis I put forward in the book 25 years ago.  I've been paying some attention to that market, especially when, in 2013, a dramatic parabolic top occurred into a new moon. One of the primary points of the Spiral Calendar was to look for emotional tops near new moons, with stocks in 1929 and 1987 and gold in 1980 as prime examples.  This year's new parabolic move in bitcoin and ethereum has me taking these markets seriously as test cases for Spiral Calendar analysis. The results, as the charts show, are extraordinary.  The Spiral Calendar has always been about finding fragments of these structures. Yet in its pure form of emotional speculation, bitcoin gives us extra ordinarily complete spiral structures, and ones that are anchored to the lunar phase/seasonal extremes as originally postulated by me twenty-five years ago.  These results are a tremendous affirmation of the original work. And ultimately, and much more importantly, they are dramatic and direct evidence of the engines at work on human consciousness. An important breakthrough in understanding what forces are driving behavior, and how those forces generate group/mob behavior. What follows are some charts. I think they speak for themselves. If you haven't read The Spiral Calendar book, it is out of print, but there are plenty of used and some new, copies available from Amazon at the link on the left of the page.

Those charts with implication for bitcoin's future price direction are behind the paywall, along with my commentary on short-term price expectations in bitcoin now.  Enjoy!

Click chart to enlarge (It's Big!)

Click chart to enlarge

Click chart to enlarge

Subscribe to see the rest of this post.

Spirals Trump Moons

That Spiral Calendar date was important after all!  The lunar calendar had to wait for the Spiral to finish its business.

110116ndxd

click chart to enlarge October 24/25 was an important Spiral Calendar date.

110116pump

click chart to enlarge Falling dollar reflates the Money Printing Pump.

110116newlows

click chart to enlarge New lows waking up from a long slumber.

110116separate

click chart to enlarge Divorce.

10116spxad

click chart to enlarge video discussion inside.

Subscribe to see the rest of this post.

Chartopia

I'll let the charts do the talking today.

101616moneypump

click chart to enlarge The "Money Printing Pump"

101616pump

click chart to enlarge Zooming in on the pump. The dollar rally is not helpful to the pump's power to inflate markets.

101616jspbsldhr

click chart to enlarge The Japanese balance sheet in dollars.

101616yengold

click chart to enlarge Dollar yen to 110?

101616relbalsheet

click chart to enlarge Dollar yen to 150?  I don't think so. But exchange rates now don't reflect relative balance sheet size.

101616nikspx

click chart to enlarge Is everything correlated these days?

101616spxad

click chart to enlarge

1016163dnewhighs

click chart to enlarge

1016163dnewlows

click chart to enlarge

101616compel

click chart to enlarge This chart offers compelling "proof" of the research into lunar/solar phenomena that has been the hallmark of my research for over twenty-five years. phenomena I first observed standing in a trading pit.

Much more inside!

Subscribe to see the rest of this post.

The TellTale

I expect a rally next week. The health, or lack of, exhibited by the rally will be the telltale for what to expect in the remainder of October.

100116pump

click chart to enlarge

100116goldyen

click chart to enlarge

100116spxad

click chart to enlarge

1001163dnewhighs

click chart to enlarge

The good stuff's inside. Won't you join us?

Subscribe to see the rest of this post.