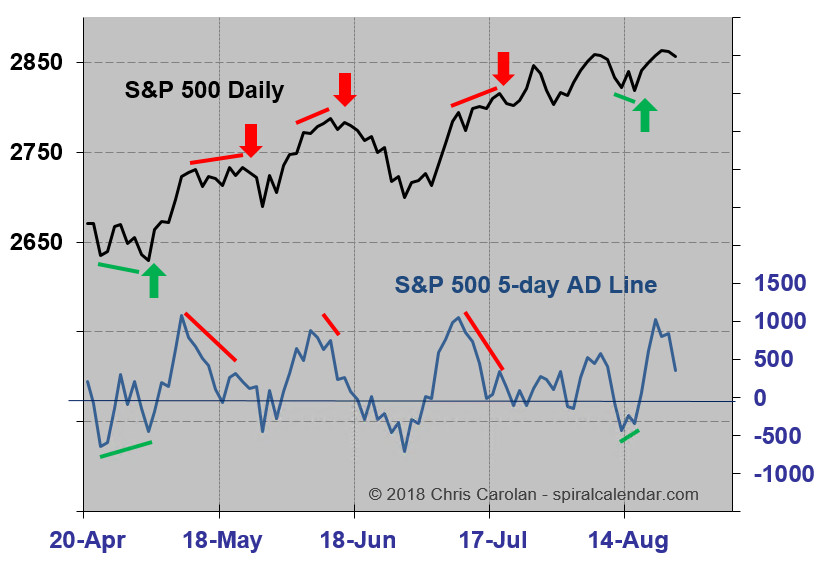
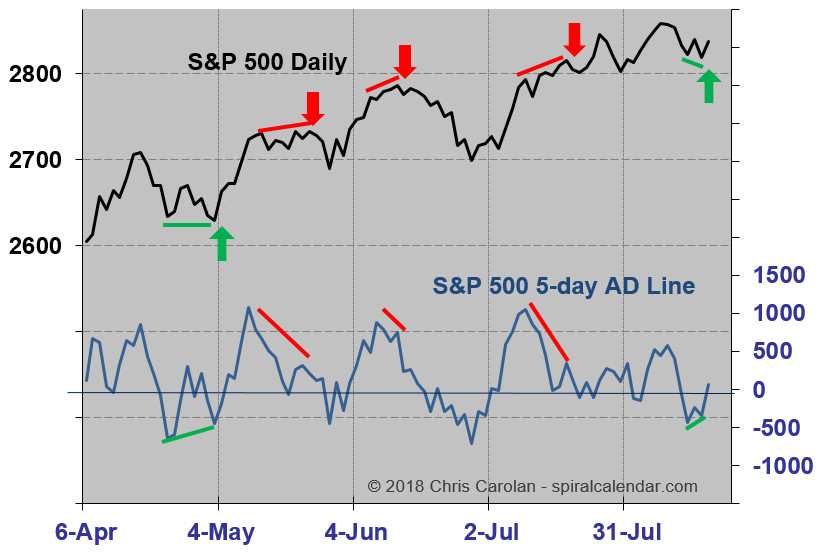
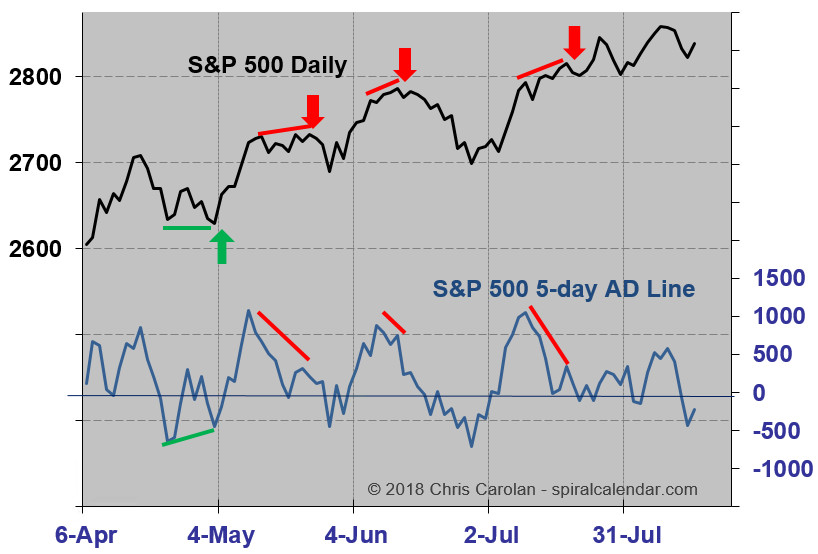
The late up close in the S&P prevented a bearish divergence signal in the breadth oscillator shown below.
click chart to enlarge
click chart to enlarge
click chart to enlarge
click chart to enlarge
click chart to enlarge
click chart to enlarge
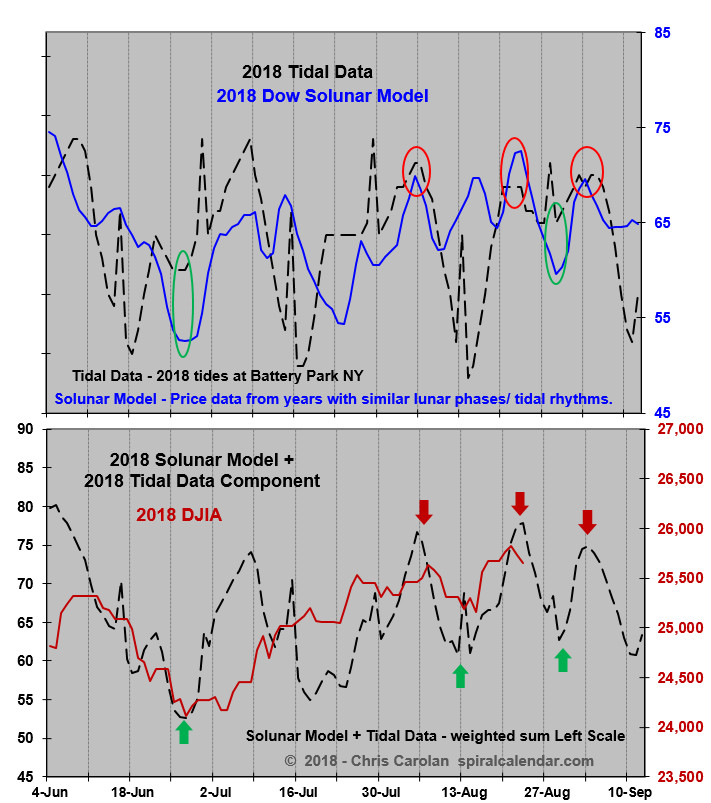
The August 20 weak retest fit our Spiral Calendar expectations.
click to enlarge
click to enlarge
click chart to enlarge
click chart to enlarge
This chart updated through October in the subscriber area.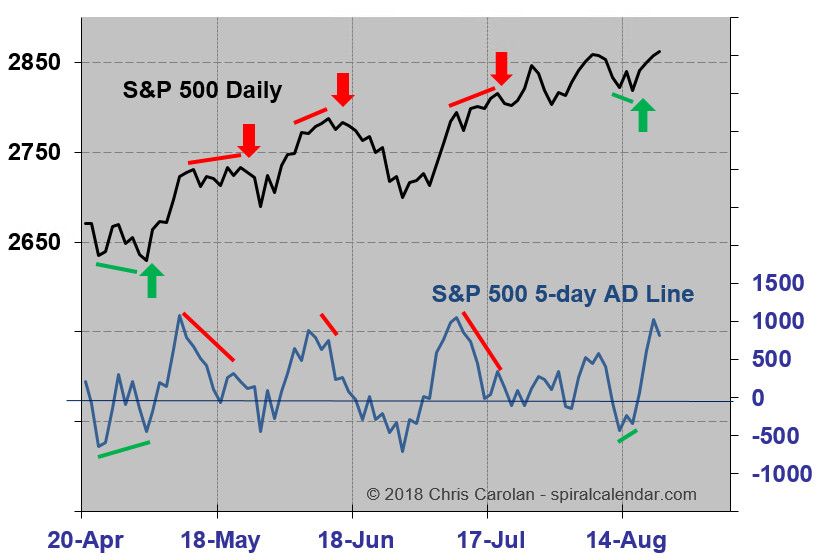
click chart to enlarge

click chart to enlarge
click chart to enlarge
click chart to enlarge
click chart to enlarge
click chart to enlarge
click chart to enlarge
click chart to enlarge
click chart to enlarge