I suppose the Brexit question is whether Britain can escape the gravitational pull of Europe. I'd rather watch than guess until this Brexit madness is done with.
click chart to enlarge
I suppose the Brexit question is whether Britain can escape the gravitational pull of Europe. I'd rather watch than guess until this Brexit madness is done with.
click chart to enlarge
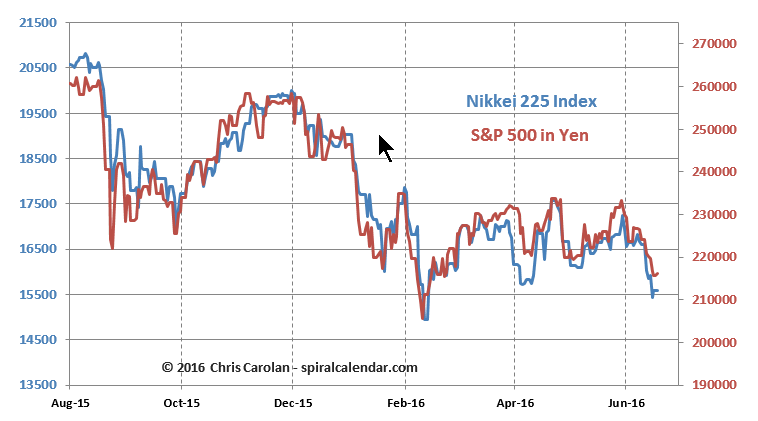
I'm not a believer in rallies here.
click chart to enlarge

click chart to enlarge
click chart to enlarge
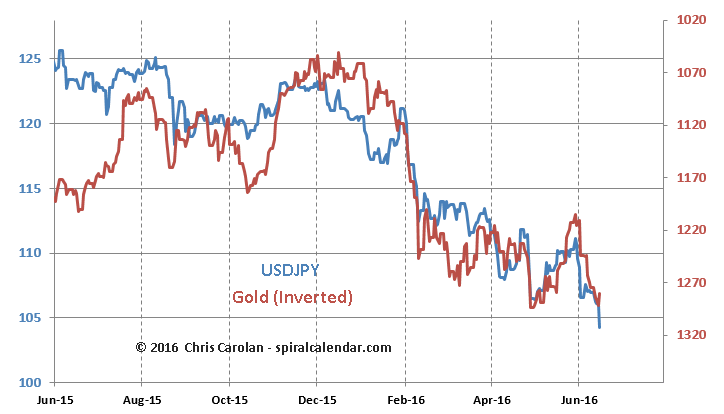
Can gold decline without a similar turn in dollar yen? I doubt it.
click chart to enlarge
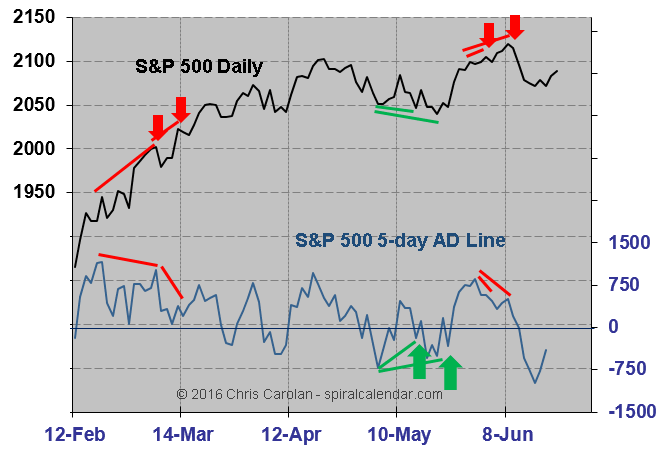
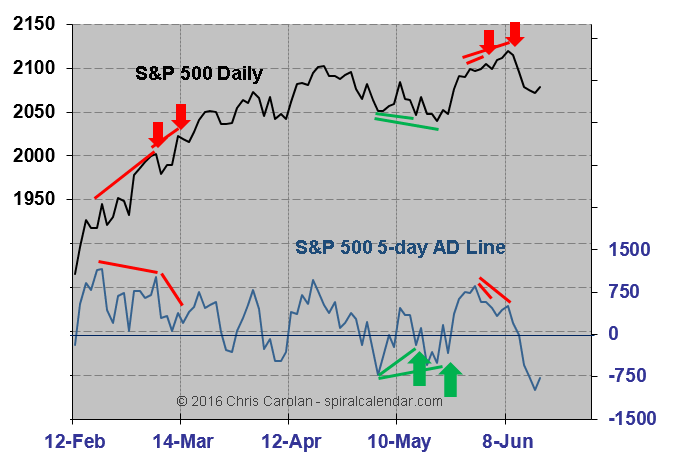
Oversold but no divergence.
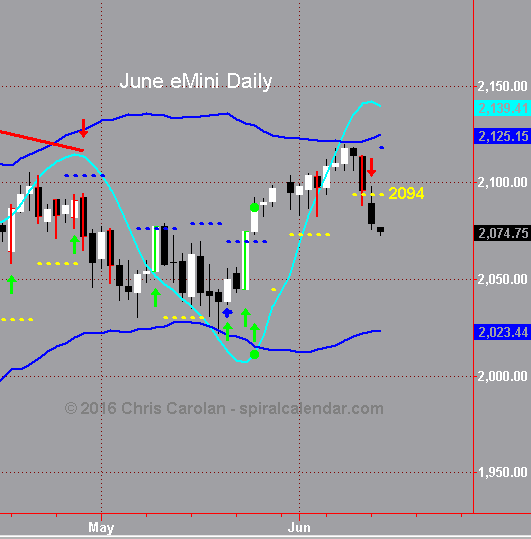
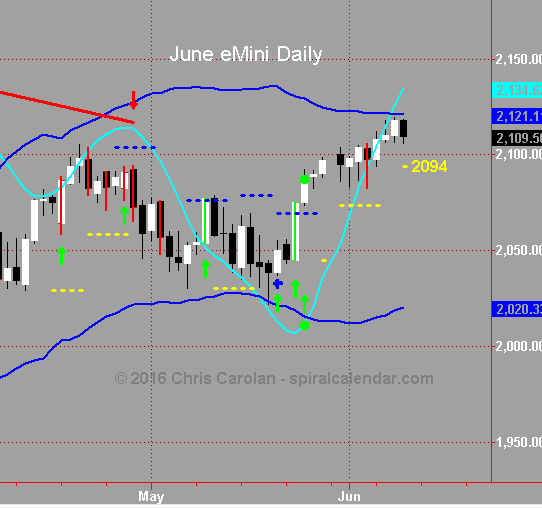
Thursday’s post noted the intraday net line sell would likely result in a daily net line sell once the intraday target was hit. That daily net-line close below 2094 occurred today, and this net-line sell has a target of 2023. The market is deteriorating very quickly following this Spiral Calendar top. If we are only three days into a three week move, there will be significant damage.
click chart to enlarge
click chart to enlarge
click chart to enlarge
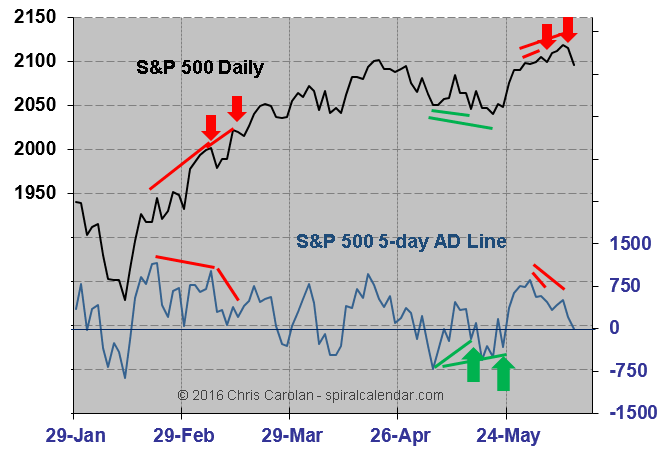
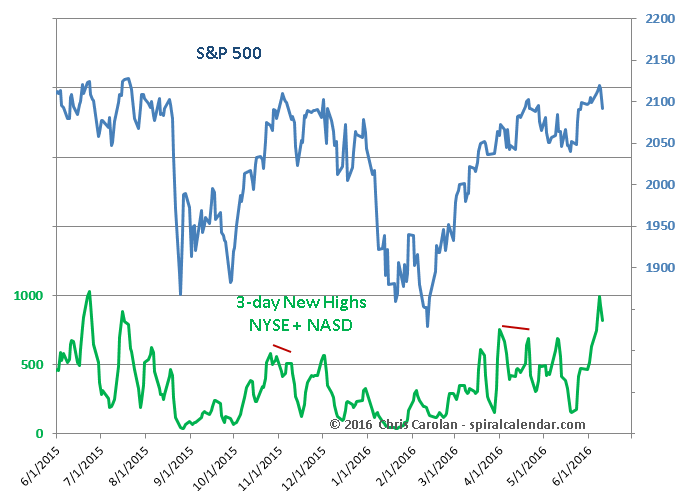
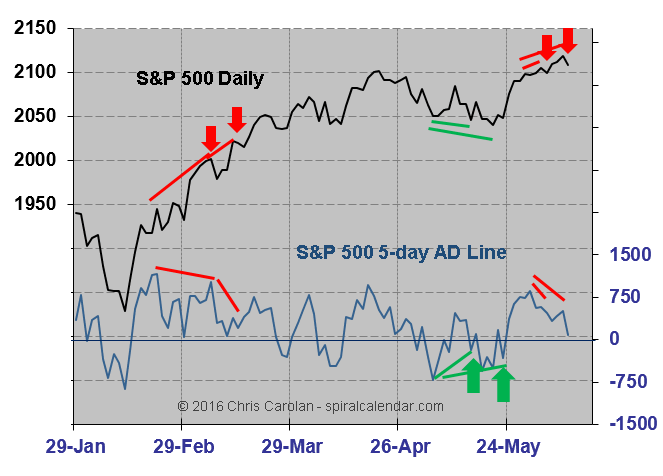
Add up to a sell now.
click chart to enlarge
click chart to enlarge
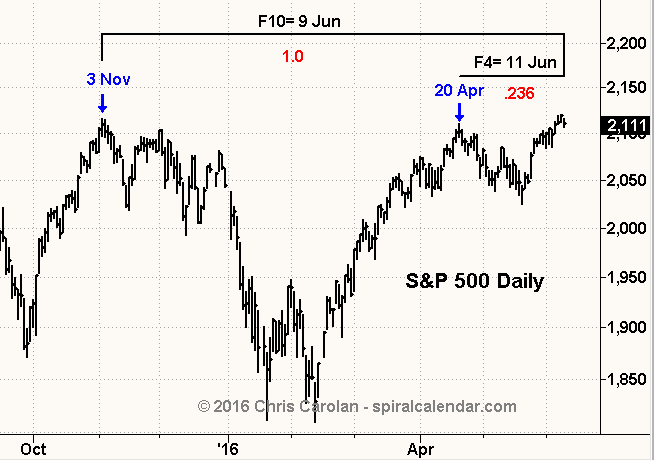
Unfolding perfectly here.
click chart to enlarge
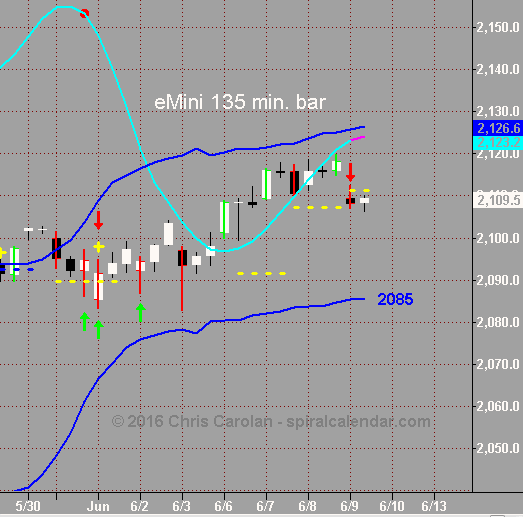
The intraday 135-minute RTH eMini chart issued a net-line sell this morning. The target is now at 2085.
click chart to enlarge
If that 2085 target is reached in the next few days, it implies a likely trigger of the 2094 daily net-line. A confirmed sell on the daily will target 2020, or a 4% decline from current levels.
click chart to enlarge
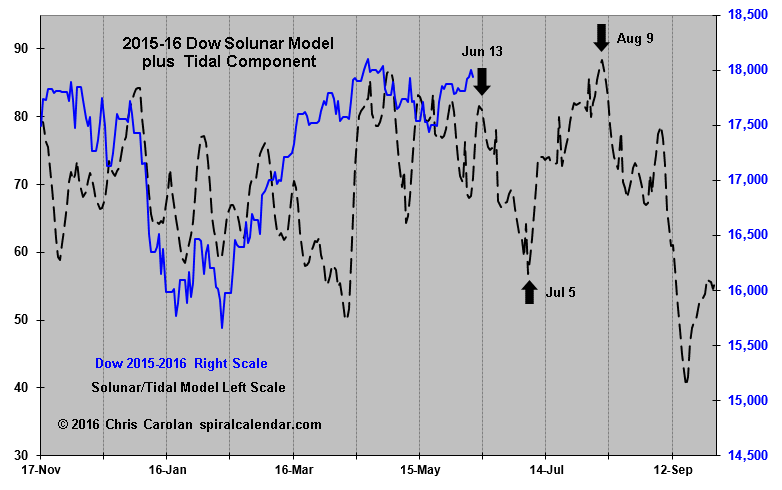
The combined Solunar/Tidal is a few days away from a very negative, three-week period.