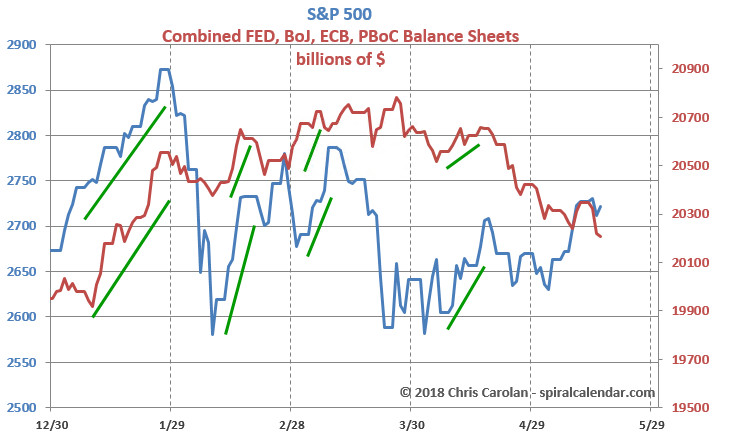
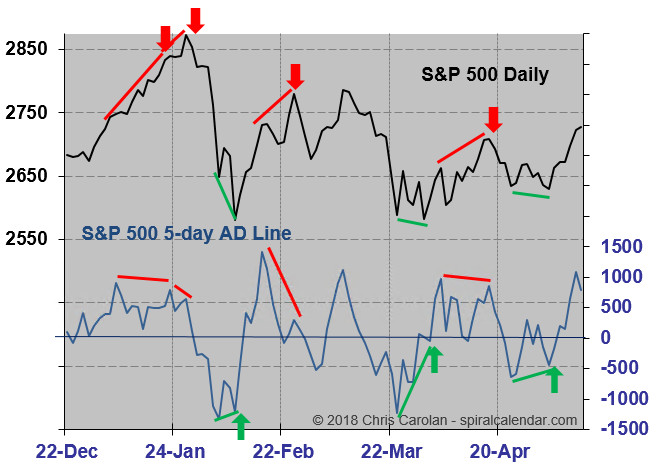
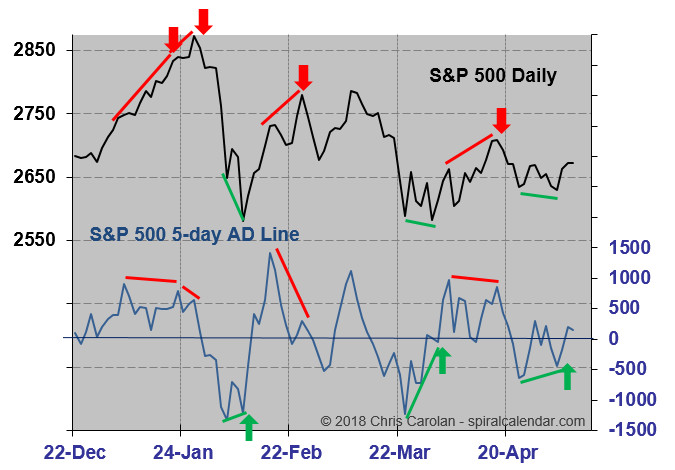
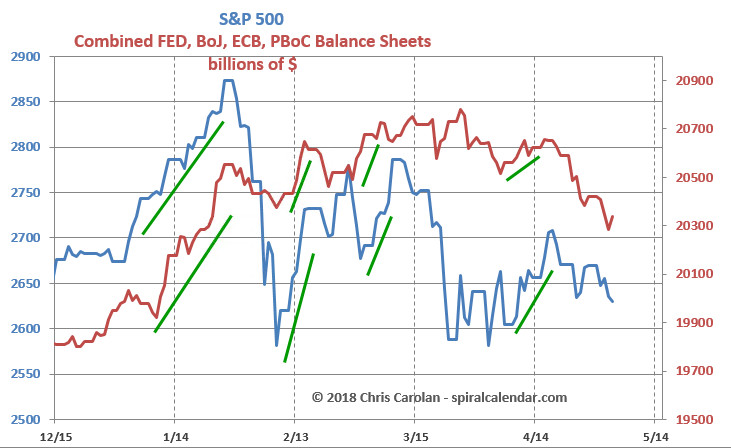
The "Money Printing Pump" continues it recent streak, moving precisely in line with the S&P 500 every day. There is a clear, concerted effort to push the dollar lower in order to prop up equity prices.
Over the years (25 to be exact) I've noticed the Solunar Model charts work well in emotional markets and are pretty much useless in boring, non-trending markets. We don't need these charts to know markets are emotional now. But it sure is interesting to see how well these charts (inside) have done of late.
I first started publishing charts comparing CB asset levels with equity prices in 2010. This latest chart zooms in on the "Money Printing Pump" for the past few months. It is important to understand that CB balance sheets in dollar terms are sensitive to exchange rates. A weaker dollar inflates balance sheets, a stronger dollar depresses them. In recent weeks stocks have become "locked in" to the fate of the Money Printing Pump. The dollar has to continually weaken to keep the game going at this point. A dollar rally will torpedo the equity market.
click chart to enlarge
Solunar and tidal charts as well as a video discussion of daily and weekly candle charts is inside.
Bitcoin reversed right on the upper, daily Keltner channel level on Tuesday. The expired 9372 net line level is providing some support over the past 24 hours.
click chart to enlarge
The weekly chart shows last week's reversal coming in right under the net line resistance level.
Spiral Calendar analysis inside.