That's a direct quote from today's unscripted video discussion.

click chart to enlarge
click chart to enlarge
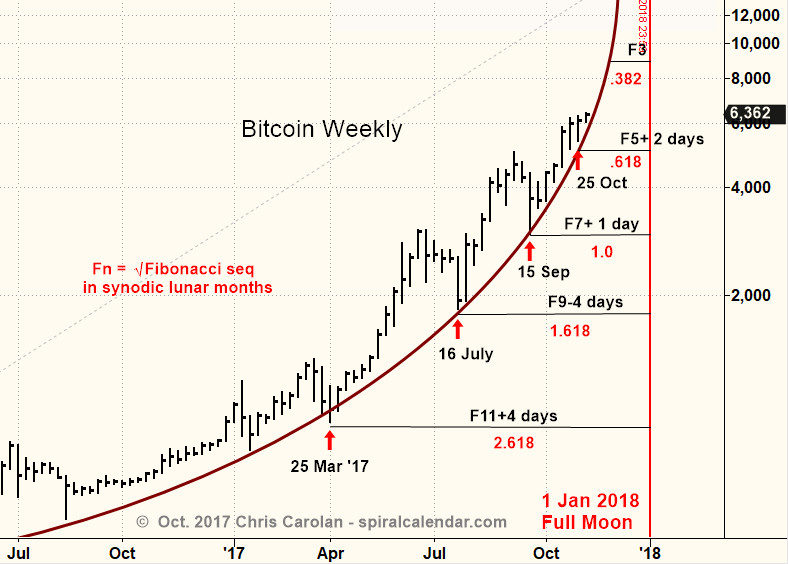
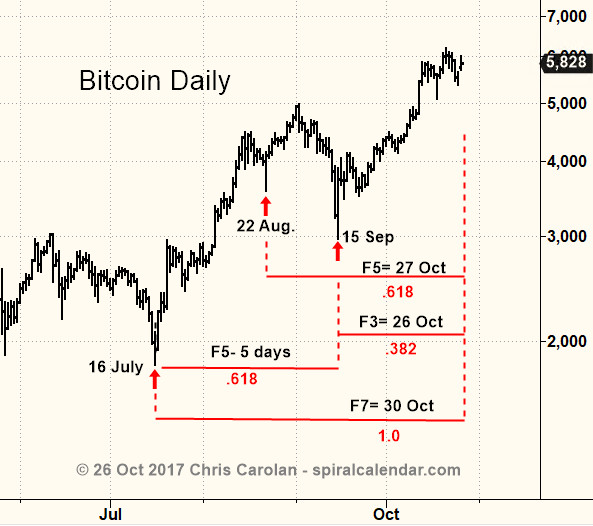
click chart to enlarge Bitcoin, devoid of 'fundamental noise,' shows nature's pure cycles.

click chart to enlarge
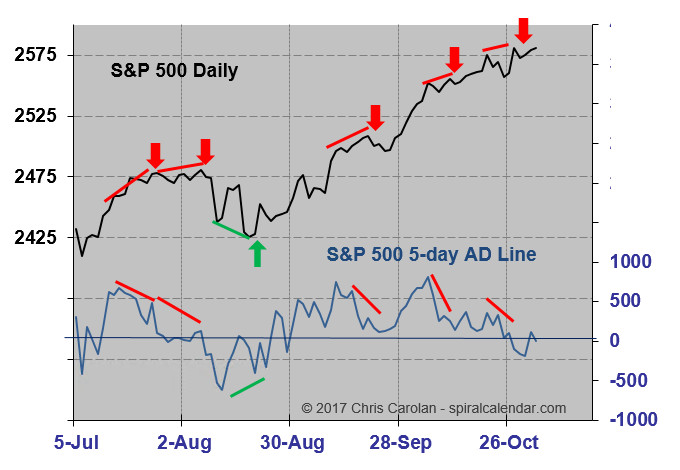
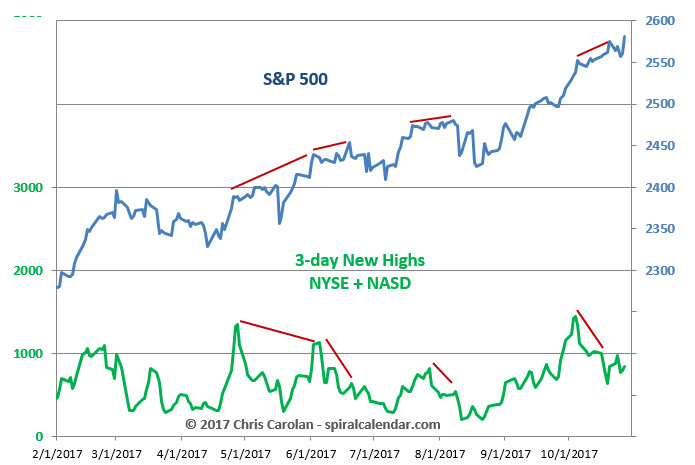
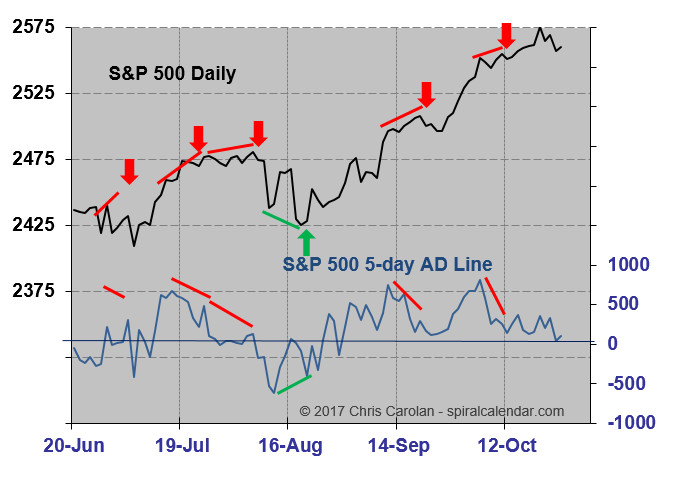
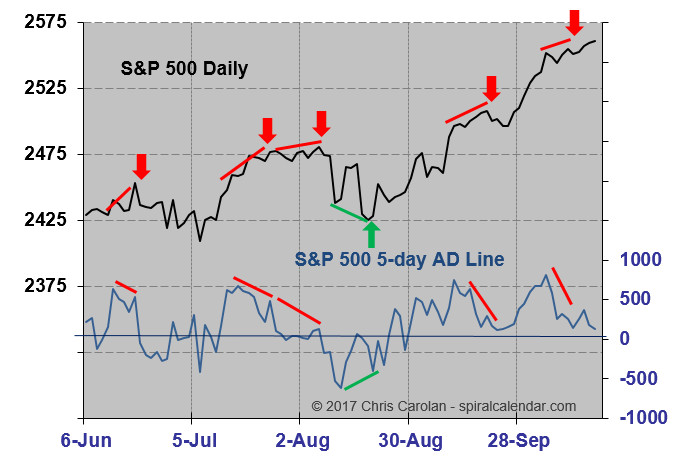
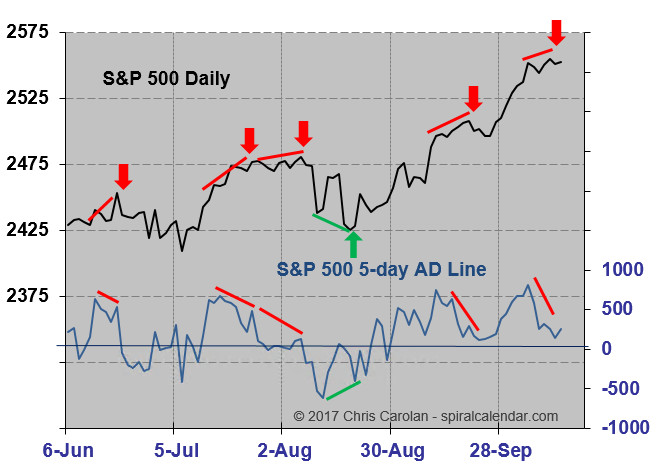
Breadth looking a little punk here.
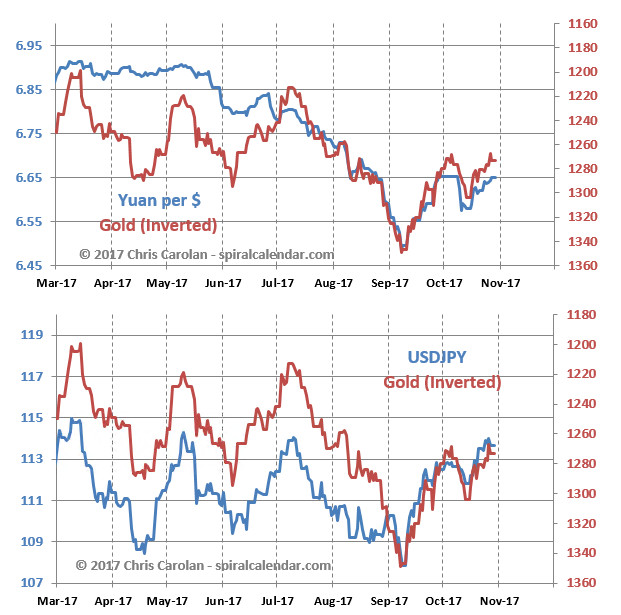
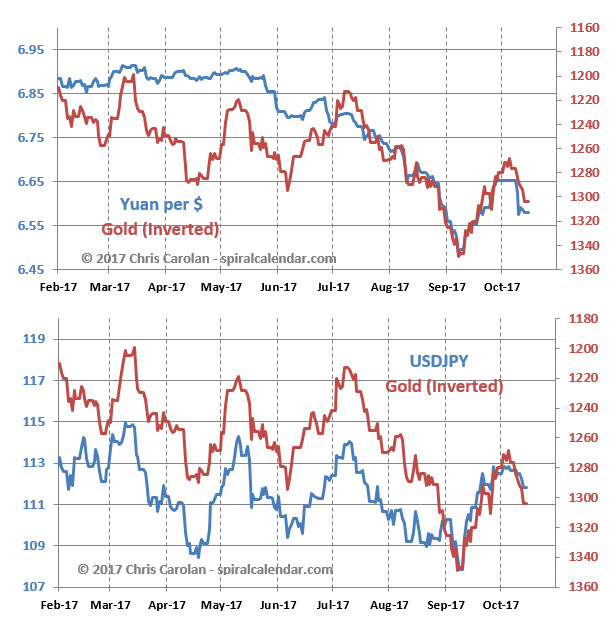
click chart to enlarge Yuan, dollar yen, and gold - there's only one currency rate now.
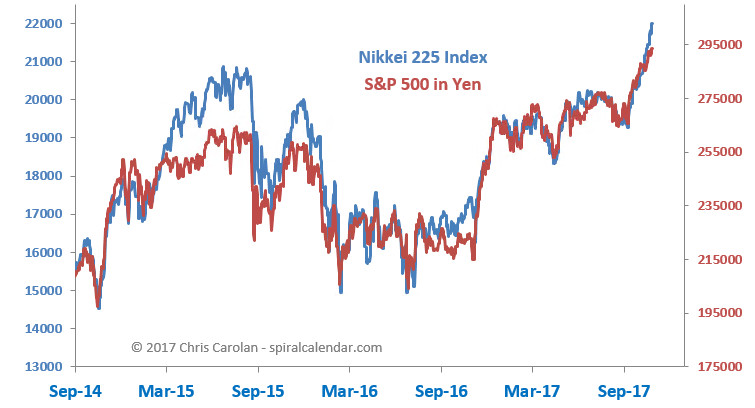
click chart to enlarge And that one currency rate is all that separates Japanese and U.S. equities.
 click chart to enlarge
What's going on here?
click chart to enlarge
What's going on here?
click chart to enlarge
eMinis give us a sell, but not as strong as it could have been.
 Click chart to enlarge
Click chart to enlarge Bitcoin, low on May 25? Or top imminent?

click chart to enlarge

click chart to enlarge
click chart to enlarge
click chart to enlarge
click chart to enlarge