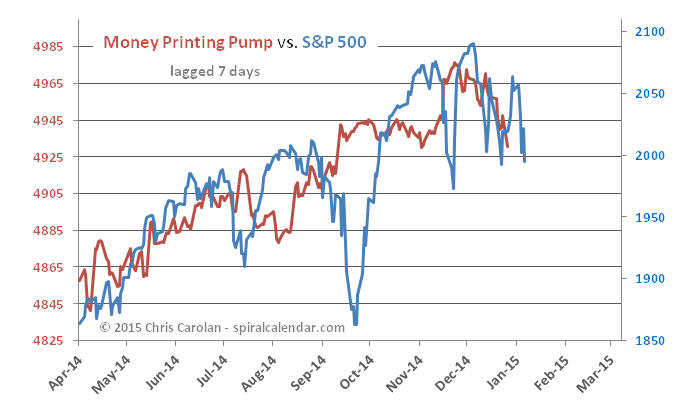
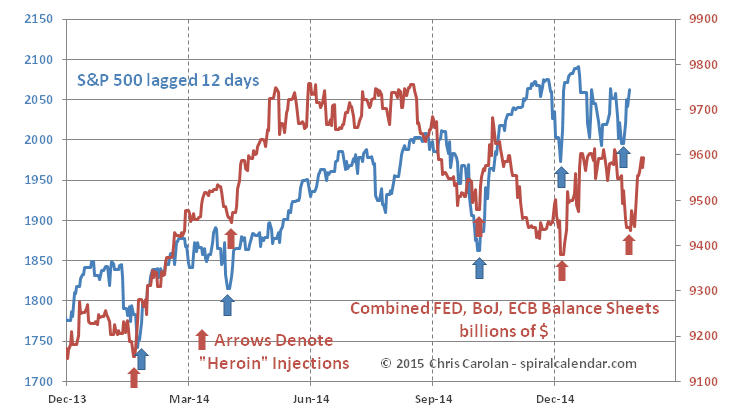
A weaker dollar raised the value of non-dollar central bank collateral, which supports stock prices, as seen in my "Heroin" chart. Recent dollar weakness combined with an increase in the ECB balance sheet has once again goosed the S&P averages. The lag seems to have shrunk from about 12 days to 6.
click chart to enlarge