Spiral Calendar analysis, price analysis, Solunar & tidal analysis, are all combining for a clear, bearish forecast.
click chart to enlarge
click chart to enlarge
click chart to enlarge
click chart to enlarge
Add up to a sell now.
click chart to enlarge
click chart to enlarge
Unfolding perfectly here.
click chart to enlarge
The intraday 135-minute RTH eMini chart issued a net-line sell this morning. The target is now at 2085.
click chart to enlarge
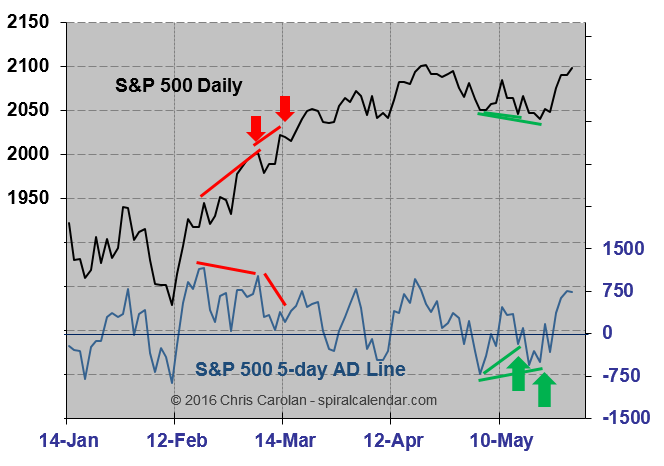
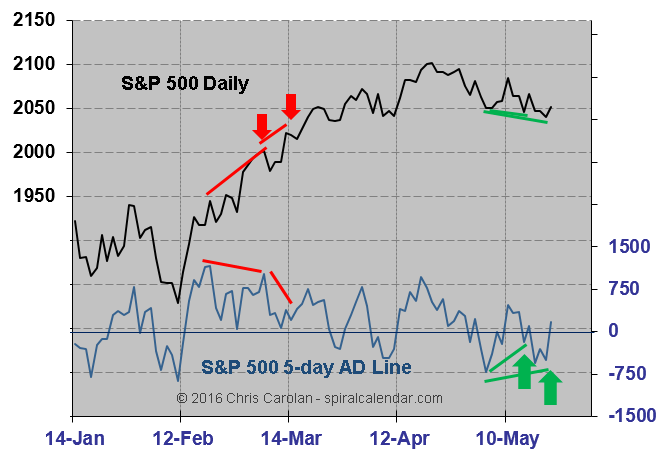
If that 2085 target is reached in the next few days, it implies a likely trigger of the 2094 daily net-line. A confirmed sell on the daily will target 2020, or a 4% decline from current levels.
click chart to enlarge
The combined Solunar/Tidal is a few days away from a very negative, three-week period.
click chart to enlarge
Three day new highs up into potential top territory.
click chart to enlarge
The timing argument for a top is inside for subscribers.
click chart to enlarge The Money Printing Pump - not bearish. The bankers are getting less bang for their buck here though.

click chart to enlarge detail
click chart to enlarge Gold is cheaper AFTER it went up $30.
click chart to enlarge

click chart to enlarge
click chart to enlarge The buck is cheap versus the yen on a relative money-printing basis.

click chart to enlarge
Either gold or the dollar is cheap here - pick one.
 click chart to enlarge

click chart to enlarge
The bulls may have the edge into month’s end.
click chart to enlarge

click chart to enlarge
but eventually this triangle breaks lower.